
Supervised learning is used in a wide range of real-world applications. From its use in computer vision to locate, isolate, and categorize objects, to identifying spam emails on a daily basis, supervised learning can be a helpful tool in anticipating results and extrapolating vital information from large volumes of data.
Engineers can even use it to build extremely accurate machine learning models, but just how does supervised learning work? In this article, we’ll cover:
What is supervised machine learning?
Supervised machine learning is a subcategory of both artificial intelligence and machine learning. Also known as just “supervised learning”, it uses labeled datasets to train algorithms, which accurately classify data or predict outcomes. Essentially, there are input variables and an individual output variable that use an algorithm to learn the mapping function from the input to the output.
How does supervised machine learning work?
With supervised learning, the model is trained until it can detect relationships and patterns between the input and output variables. It’s ideal for classification and regression problems:
- Classification. When the input variable is a category, like “disease” and “no disease”.
- Regression. When the output variable is a real value, like “weight”.

7 supervised learning algorithms
1. Random forest
Built from decision tree algorithms, a random forest helps to predict outcomes and behavior in regression and classification problems. The random forest algorithm has various decision trees, with the forest being generated through either bootstrap or bagging aggregation, the latter of which is an ensemble meta-algorithm that improves machine learning algorithms’ accuracy.
The outcome is established according to the predictions of the decision tree, which is done by taking the mean or average of the output from various trees. If you want to increase the precision of the outcome, then you have to increase the number of trees.
Decision tree algorithms can be limited, and a random forest addresses those issues by minimizing the overfitting datasets and increasing precision. You should avoid random forests when there isn’t enough data, as you’ll have unproductive splits that’ll affect the outcome and the extrapolation of data.
What are the applications of random forests?
- E-commerce. RainForest algorithms help vendors to predict customer preferences based on past behavior.
- Banking. Useful in predicting the creditworthiness of loan applicants and in detecting fraudsters.
- Healthcare. Random forests are great for diagnosing patients by assessing past medical history, and past medical records can help to establish the right dosages for patient medication.
2. Support vector machine (SVM)
SVM is a supervised machine learning problem in which the goal is to find a hyperplane that will better separate the two classes, and it works best when you have a small and complex dataset. The advice is to first try logistic regression, and if it doesn’t produce accurate results, then you should use SVM without any kernel.
What are the different types of SVM?
- Linear SVM. This type is used when the data is linearly separable, which means that data points are classified into two classes by using a single straight line in 2D.
- Non-linear SVM. When your data isn’t linearly separable, non-linear SVM uses kernel tricks to classify data points.
What is a kernel?
In machine learning, a kernel is a method that allows for the application of linear classifiers to non-linear problems. It maps non-linear data into higher-dimensional spaces, not needing to visit or understand the space.
Different functions of kernels:
- Sigmoid kernel. Used as a proxy for neural networks.
- Bessel function kernel. Great for eliminating the cross term in mathematical functions.
- Polynomial kernel. Represents similarities of vectors in space over polynomials of the original variables, leading to the learning of non-linear models.
- Anova kernel. Useful for multidimensional regression problems.
- RBF kernel. Creates non-linear combinations of features to lift samples onto a higher-dimensional space, allowing for the use of linear decision boundaries to separate classes. The most used SVM kernel.
3. Linear regression
Used to help identify relationships between dependent variables and one or more independent variables. The models are relatively simple, and they offer a mathematical formula that generates predictions and is easy to understand. Thre are two main types of linear regression:
Simple regression
This type uses a traditional slope-intercept form, with m and b being the variables that the algorithm tries to learn for accurate predictions, x being the input data, and y being the prediction: y = mx + b.
Multivariable regression
This is an extension of multiple regressions that have one dependent variable and multiple independent variables. In this equation, with w being the coefficients that the model tries to learn and x, y, and x being the attributes, we’d have: f(x, y, z) = w1x + w2y + w3z.
Examples of linear regression:
- Risk analysis. Models can be built to estimate claim costs in insurance claims.
- Pricing elasticity. Helpful to pinpoint if product consumption will drop as product price increases.
- Sports analysis. Using a scatterplot, you can determine if variables are linearly related, which means that you’d be able to determine if, for example, the number of games a team wins and the number of points that the opponent scores are related.
4. Logistic regression
Also known as a “logit model”, a logistic regression model is typically used for predictive and classification analysis. It estimates the probability of an event happening based on given datasets of independent variables.
With the outcome being a probability, the dependent variable can be bounded between 0 and 1. The probability of success divided by the probability of failure, or the logit transformation, is applied to the odds. This is known as the log odds - the natural logarithm of odds.
What are the types of logistic regression?
- Ordinal logistic regression. Used on the response variable has three or more possible outcomes. Ordinal responses can be grading scales, from A to F, or rating scales, from 1 to 5.
- Binary logistic regression. The dependent variable is dichotomous, only having two possible outcomes. This type of logistic regression is the most used, being the most common classifier for binary classification.
- Multinomial logistic regression. The dependent variable has three or more possible outcomes, but the values don’t have any specific order.
Examples of logistic regression:
- Churn prediction. Logistic regression can help companies to set up effective retention strategies by predicting which clients are at risk of purchasing from the competition.
- Fraud detection. Helpful to identify anomalies, behaviors, or characteristics that are most commonly associated with fraudulent activities.
- Disease prediction. Useful to predict the probability of illness or disease in specific populations.
5. K-nearest neighbors (KNN)
Also known as k-NN, the K-nearest neighbors algorithm is a non-parametric, supervised learning classifier. It uses proximity to make predictions or classifications about the grouping of a single data point. It’s commonly used as a classification algorithm, however, it can sometimes be used for regression problems.
What are the applications of KNN?
- Healthcare. Helping to make predictions about heart attack and prostate cancer risks, the algorithm calculates the most likely gene expressions.
- Pattern recognition. Used to identify patterns, like handwritten numbers in forms.
- Recommendation engines. Offers automatic recommendations to users about additional content, as users are assigned particular groups and given recommendations based on that behavior.
- Data pre-processing. KNN can help when datasets have missing values, as it estimates the values through a process called missing data imputation.
- Risk assessment. KNN can help banks assess loan risks or creditworthiness.
What are the pros and cons of KNN?
- Pro: has few hyperparameters.
- Pro: adapts easily.
- Pro: easy to implement.
- Con: not ideal for scaling.
- Con: it’s prone to overfitting.
- Con: doesn’t perform well with high-dimensional data.
6. Naive Bayes
This classifier is a probabilistic machine learning model for classification tasks, based on the now Bayes’ theorem (most recently, the Bayes-Price theorem).
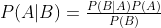
The theorem allows you to find the probability of A happening, considering that B has already happened. It’s assumed that the predictors are independent, meaning that the presence of a feature doesn’t affect the other, which is why it’s called naive.
Types of Naive Bayes:
- Gaussian Naive Bayes. When predictors aren't discrete and instead take up a continuous value, you can assume that the values are sampled from a gaussian distribution.
- Multinomial Naive Bayes. Ideal for document classification problems, where the predictors the classifier uses are the frequencies of words in the documents.
- Bernoulli Naive Bayes. The predictors are boolean variables, with the parameters to predict class variables only having a yes or no value.
7. Neural networks
Neural networks copy the interconnectivity of the human brain through node layers, with each node being made up of weights, inputs, outputs, and bias (or threshold). When an output value exceeds the threshold, it activates the node and passes data to the next layer in the neural network.
The neural networks learn the mapping function with supervised learning and adjust according to the loss function by the process of gradient descent. The model accurately provides a correct answer on the cost function is either at or near zero.
Types of neural networks:
- Modular neural network
- Radial basis neural network
- Convolutional neural network
- LSTM (or long-short-term memory)
- Sequence to sequence models
- Perceptron
- Multilayer perceptron
- Recurrent neural network
- Feed forward neural network
Take a look below at how to use feed forward neural networks to classify numbers and clothes:
 Shiza Charania
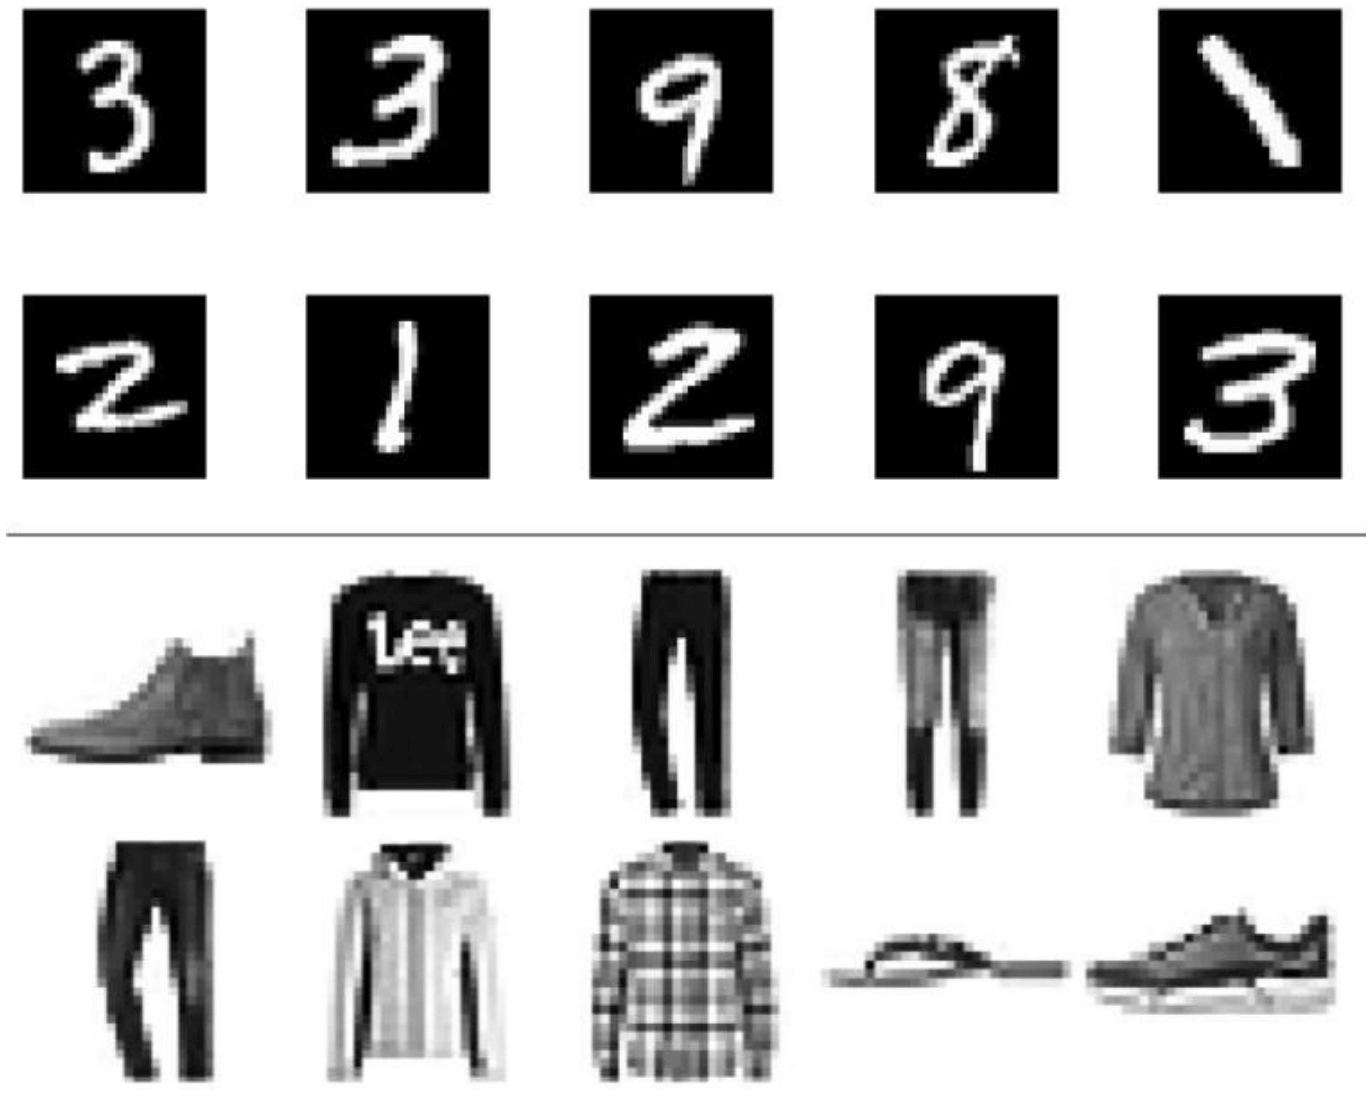


AI accelerator insider insider
Thank you for subscribing
Level up your ai accelerator insider career & network with ai accelerator insider experts.
An email has been successfully sent to confirm your subscription.
 Follow us on LinkedIn

