Machine and deep learning have the potential to have a huge impact on healthcare. In this article, I’m going to take you through some key examples of how we’re accomplishing this at Phillips, and how this points the way to the future of healthcare!
We’re going to break down three applications in particular. For each one, I want to describe the problem and give a little bit of motivation for why we want to use machine learning-based approaches to tackle them.
Here’s a breakdown of the main talking points:
- Analyzing data in the electronic health record
- Detecting heart rhythms from ECG waveforms
- Segmenting brain lesions and 3D medical images
- To wrap up
Analyzing data in the electronic health record
This is data such as vital signs, lab values, medication information, and data we use in order to predict life-threatening events in the intensive care unit. The aim is to predict whether a patient may develop certain conditions.
Problem: sepsis
Let’s look at Sepsis. It's a condition that's caused by bacteria entering the bloodstream. It spreads throughout a person's body, causing uncontrolled inflammation. And when this happens, if it's not treated quite quickly, then this will lead to organ damage and then eventually death.
Needless to say, it's a major problem. It's the leading cause of death in US hospitals and kills more than half a million people in Europe and the US every year. In fact, every three seconds, somebody will die of sepsis. It's the number one cost to hospital systems, costing over $24 billion a year.
A lot of these deaths could be avoided if we could just do something about it a little bit sooner. In fact, for every hour that treatment is delayed, there's an 8% increase in patients' risk of death and their mortality.
Approach: RNNs and TCNs
We use a combination of recurrent neural networks (RNNs) with temporal convolutional neural networks (TCNs). TCN is effectively just an alternative to a recurrent neural network. But it uses convolutions and you can apply it to sequential time series data.
These approaches have obviously been used very successfully in things like natural language processing. And they're also a component of automatic speech recognition systems. When we apply things like RNNs to this clinical time-series data from the EMR, the data can be very noisy. There are missing values that we have to deal with.
The data can also just be complete garbage. Sometimes you see values that are outside the range of physiologically plausible values. We have to take these things into account when we build these models.
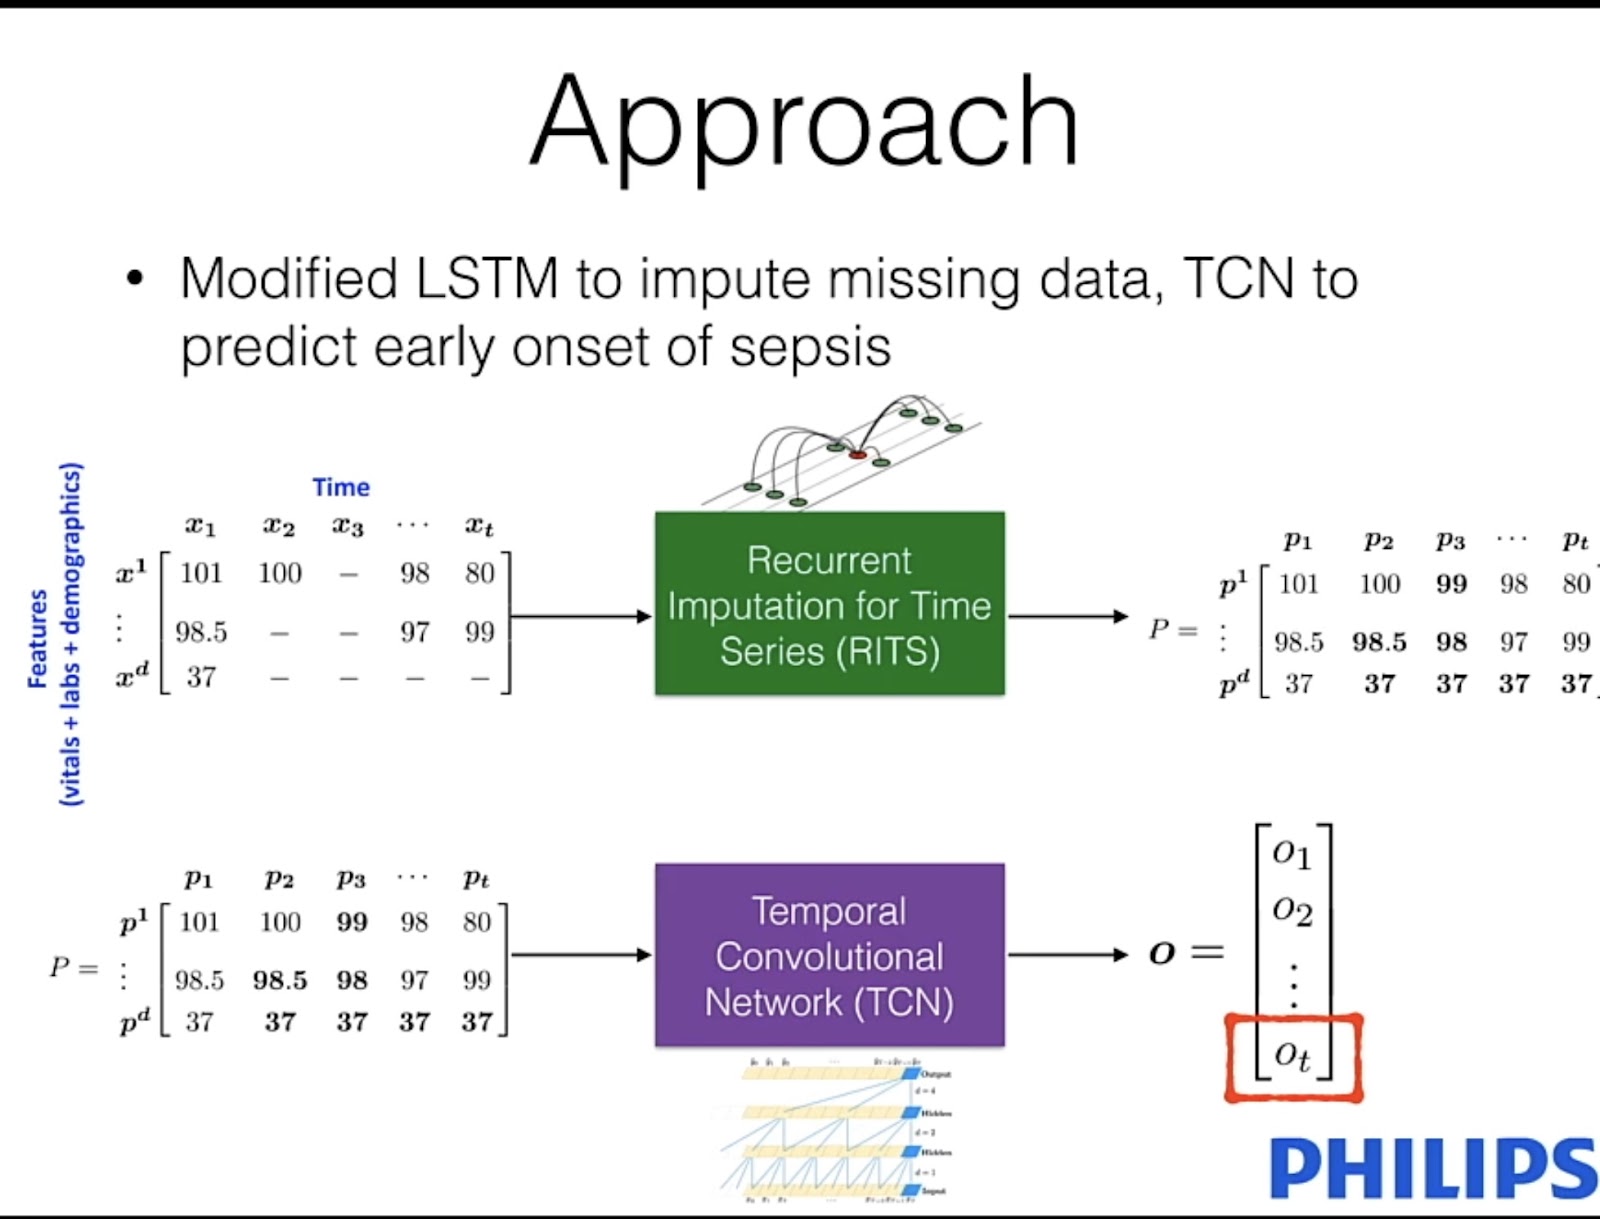
We combine recurrent neural networks with a TCM, where the input to the model is effectively just a matrix of clinical variables. These are things like your heart rate, blood pressure, and other variables where a lot of the values can be missing.
Recurrent imputation time series (RITS)
We give this matrix to an architecture known as a Recurrent imputation time series. (RITS) This is effectively just an LSTM that can handle missing information within this input.
We train this network to fill in all of this missing information so that once we get an output from the RITS model, we can take those imputations, and pass them to the temporal convolutional neural network. This is effectively spitting out a value between either ‘0’ or ‘1’, where the latter is a prediction of early sepsis.
Results
Now let’s look at some of the positive results of this process. 👇

The X-axis is time and hours, and the Y-axis is the probability of sepsis onset. This green line is the output of our classifier, a value between 1 and 0. x-axis
The goal is to push this green curve as close as possible to this vertical black line. This is the optimal time to make this prediction where it's actionable, and healthcare workers can intervene and do something that can be done for the patients.
This example just shows one case where a patient was already in the ICU within six hours of developing sepsis. We can see that the classifier very quickly starts to predict that sepsis is occurring.
Detecting heart rhythms from ECG waveforms
I want to switch gears now a bit and talk about another model that we've developed. The goal of this model is to look at physiological waveforms, but we’re looking in particular at electrocardiogram waveforms to detect whether somebody has atrial fibrillation or not.
Problem: Atrial fibrillation
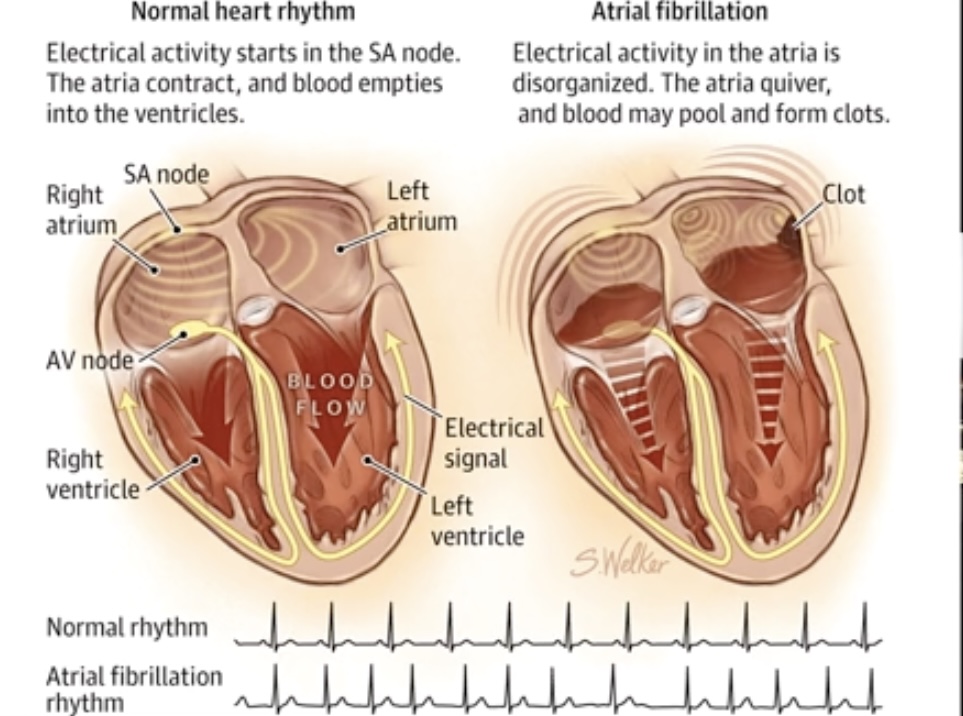
Atrial fibrillation is an abnormal heart rhythm. When the heart is beating normally, the electrical activity starts in the top portion of the heart and travels down. And this allows the heart to contract and push blood out to the body and service the vital organs.
When this is done in a normal fashion, the blood then heartbeats appropriately. If, on the other hand, somebody has atrial fibrillation, what that means is that the electrical activity is not emanating from one point at the top of the heart. The electrical activity is spread out throughout the atria here. This causes a disorganized beating of the heart.
The heart is quivering, rather than beating. It's not able to push blood around the body appropriately. And this is not good news. If the heart’s quivering, it can allow these blood clots to form in the atria.
Motivation: an extremely common problem
This is a very common problem. In fact, It's the most common sustained cardiac arrhythmia, occurring in 1 to 2% of the general population. It's associated with significant mortality due to the risk of death from stroke or coronary artery disease.
The prevalence of atrial fibrillation is also increasing, mostly due to aging populations. It's expected that in the next 30 to 50 years that the prevalence is likely to triple.
We're dealing now with physiological waveforms, and their samples have a much higher frequency than the previous example. In particular, we're looking at the ECG signal. For this model, we use Convolutional Neural Networks, which have obviously had great success in computer vision with image classification.

With fibrillation detection, we may have noisy input, but we also have noisy labels. And this comes about because of interrater disagreement. We need a cardiologist to label these signals to give ‘ground truth’.
There can be a lot of disagreement over whether something may be atrial fibrillation or just some other type of abnormal rhythm. We get noise in our labels as we train these models.
Approach: time-frequency signal representation.
We start with the ECG input. Firstly, we detect these peaks. Then we convert this one-dimensional signal into a time-frequency representation, where we capture the power information within particular frequency bands. Using the onset of these peaks, we then segment this heat map.
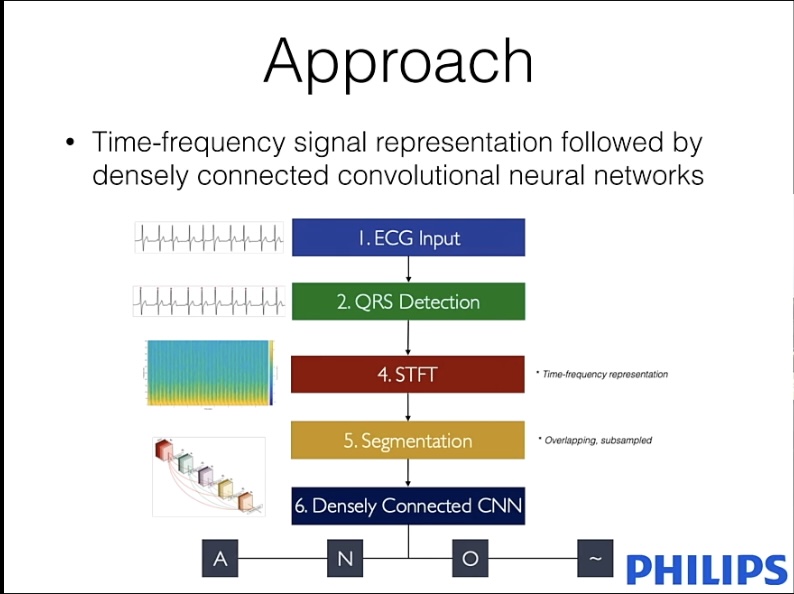
So this is effectively just an image heat map. So, we segment that up. We send all of those segments to a densely connected convolutional neural network to make a prediction about whether this segment is atrial fibrillation, whether it's normal, or whether it's some other kind of arrhythmia
Results: Segmenting different classes
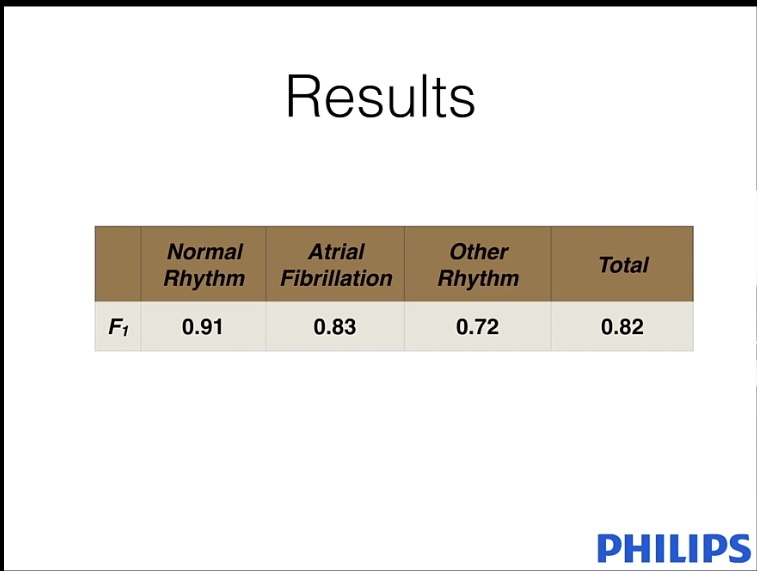
Here are the results for F1. This is just a number between 0 and 1, with the latter indicating 100% accuracy. Overall, we get an F1 score of 0. 82, and this can be broken down into three different classes.
Recognizing normal rhythms is relatively straightforward. Where classifiers have a little bit of confusion is in determining the difference between atrial fibrillation and other arrhythmias.
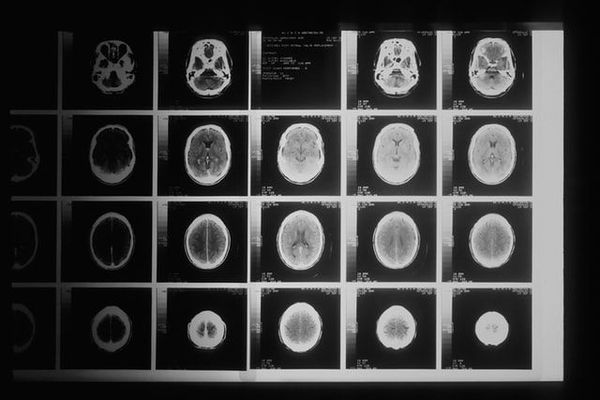
Segmenting brain lesions and 3D medical images
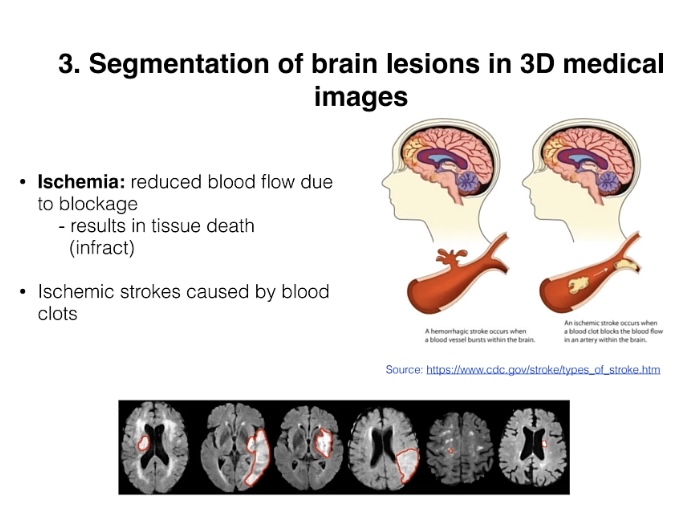
When somebody has a stroke, the most common type of stroke is an ischemic stroke. That means there’s a blood clot somewhere in a brain vessel that services an area of the brain. It's reducing blood flow to that area.
Problem: tissue death
If that blood flow is not restored, then this is going to result in tissue death. When someone has a stroke, and they go to the hospital, they'll either get a CT scan, or they'll get an MRI scan done. The goal of this work is to be able to read that scan and then automatically segment or automatically put contours around where the ischemic stroke has occurred.
This can be used for stroke treatment decisions. Now, if you look at an MRI scan, it's quite obvious to tell where the ischemic stroke lesion is. There are these white splotches that indicate this. It's much more difficult to get this information by looking at a CT scan.
However, CT has advantages over MRI, it's much cheaper, it's faster, and it's much more readily available than MRI.
Motivation: convolutional neural network
The goal of this work is to be able to do this segmentation of stroke lesions but to do it in a modality known as CT perfusion, rather than an MRI.
Now we're dealing with these 3D Medical volumes. The approach we use is a combination of a fully convolutional neural network. We may actually want to do per-pixel labeling of every pixel in the input. And to do that we use this decoder architecture.
Challenges of this process
The cost of labeling
The main problem we have with this is the cost of labeling. To label this data, we need radiologists to sit down and actually do per-voxel labeling. This is quite expensive and quite time-consuming.
This results in us having very small data set sizes we have to work with.
Label and balance
We may have a lot of pixels that are of normal tissue, but very few labels for ischemic stroke lesions. We have to deal with that imbalance in our data sets.
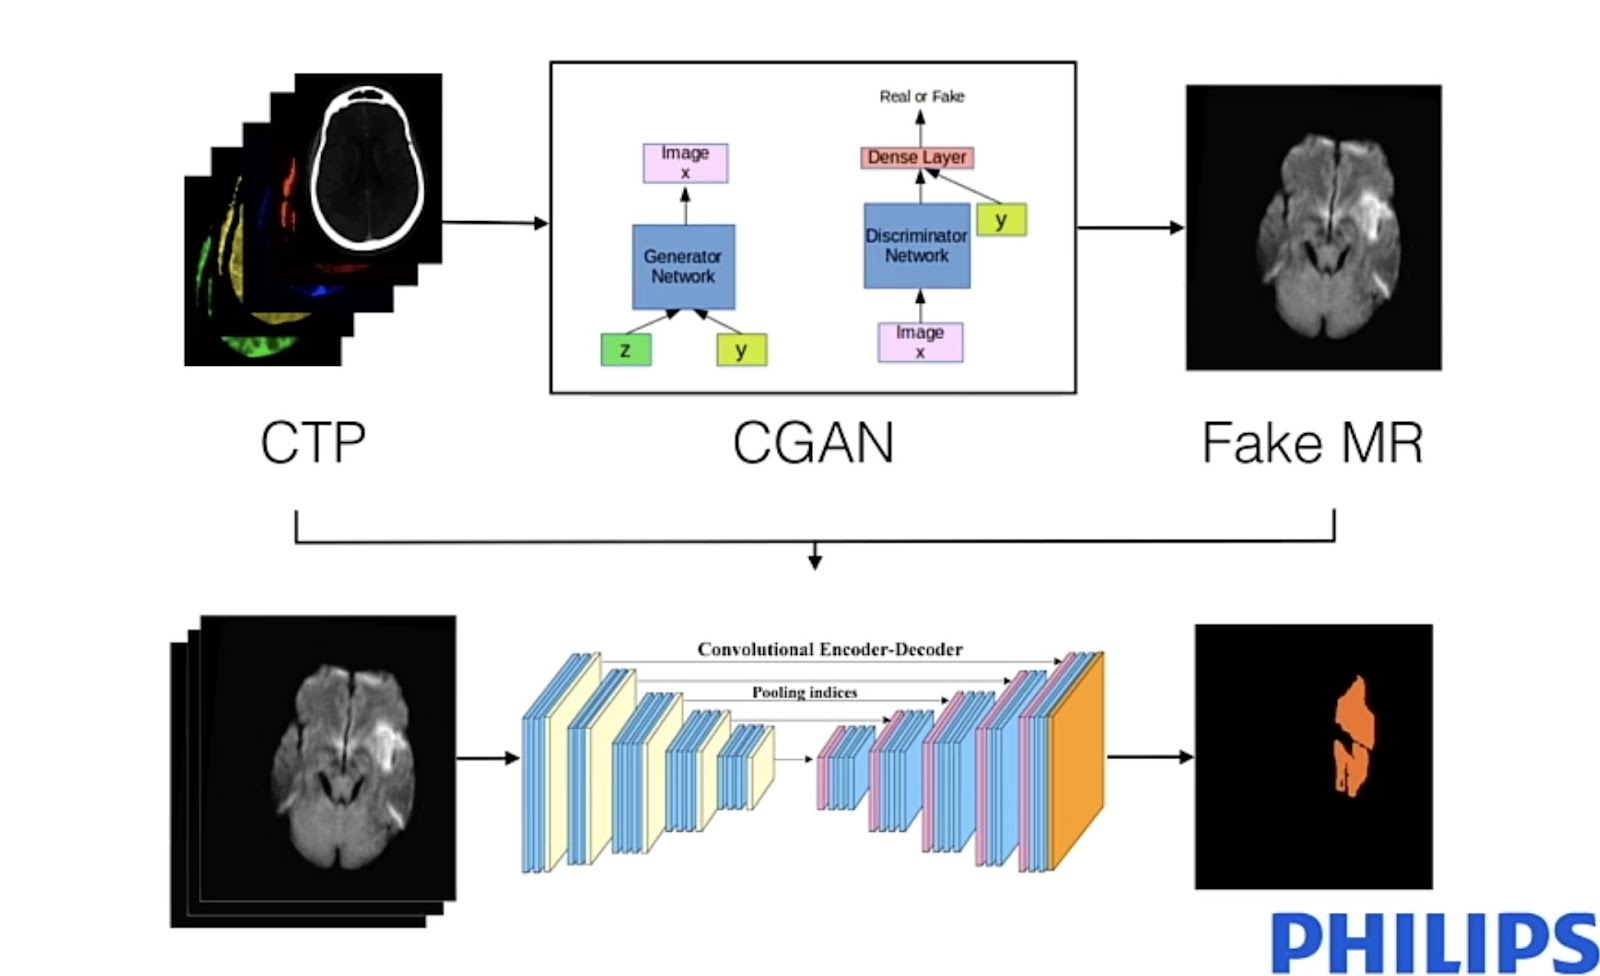
Architecture
I mentioned that we use the GANN approach. If you look at an MRI and these hyperintensities, it's much easier to do the segmentation from the MRI. What we want to do here is use a conditional again. We condition on this input, and then we generate a fake MRI slice.
After we've generated this fake MRI slice, then we can take these two bits of information and send that to our segmentation network, where now the output is basically a segmentation map. An output pixel is ‘1’ if it's a stroke lesion, or ‘0’ if it's normal.
Results: GANN training
Here are some of the results from the GANN that we trained.

The top row is a real MRI slice, and the bottom row is what we get as output from conditioning on a CT perfusion input. We don't want to fully replicate these MRI slices. What we want to do here is roughly match these hyperintense regions so that it becomes easier for our segmentation network to actually do the segmentation and find these contours.
And so here are some of the results.

The top row shows the output from the full model that uses the GANN component and the fully convolutional neural network. Red is the ‘ground truth.’ These have been labeled by radiologists. The purple splotches are what our network predicts.
We want to make these as close as possible to where the stroke lesions actually are. We then compare that to the green outputs. This is for a model that doesn't use the GANN component, and we do see improvements if we do this initial step of generating the fake MRI slice.
To wrap up: thank you
As you can see, employing deep learning in these complex procedures is no walk in the park. But I truly believe that it leads to better practices in healthcare, and the long-term benefit of this to society can’t be overstated.
We’re leading the way in cutting-edge healthcare technologies, and we hope you’ll come along for the ride with us!


AI accelerator insider insider
Thank you for subscribing
Level up your ai accelerator insider career & network with ai accelerator insider experts.
An email has been successfully sent to confirm your subscription.
 Follow us on LinkedIn