
Dr Steve Chien, Senior Research Scientist at JPL Laboratory, gave this talk at the Computer Vision Festival 2021. Catch up on the presentations from this event using our OnDemand service.
In this article, I’m going to talk to you about some of the incredible work that's going on at the Jet Propulsion Laboratory in artificial intelligence for space exploration and science. It might seem like a pretty overwhelming subject, so let’s break it down into a few key talking points.
Key talking points include:
- Computer vision and machine learning today
- Moving analysis to the edge
- Cloud detection
- Hyperspectral analysis
- Comparing different data
- Machine learning on Mars
- Autonomous targeting using computer vision
- Broad sweeps vs targeted sweeps
- Computer vision in search of ET life
Interested in the whole presentation? Download Steve's slides below:

But before we get into the main subject of this article, let’s zoom in on the history of computer vision and machine learning at JPL and how we’re utilizing it today.
Computer vision and machine learning
JPL has a long history of using computer vision and machine learning. We deal with immense data streams and datasets going all the way back to 1993.
In the Palomar Digital Sky Survey, for example, they were dealing with about three terabytes of the northern sky data. This data was typically acquired in a non-digital format. The astronomers would have to manually go in assess, for example:
- How many stars are there?
- What are the stars?
- What are the artifacts?
- What are the galaxies?
The Palomar Digital Sky Survey
You can get a glimpse of the Palomar Digital Sky Survey below. 👇

Some revolutionary work was done by some of Nick Weir in a system called SKICAT, which used rule-based learning, a system that’s similar to what's now called Random Decision Forest.
They actually cataloged this entire dataset into sky objects, and they also used the technique of transfer learning for classifying fainter objects.
Humans would manually label the subset of the data that was digitally captured. Machine learning would then use the analog data, which is a larger dataset, to classify based on just those features.
This allowed them to classify objects that were several orders of magnitude fainter.
Detection of visual transient events
Recently, the intermediate Palomar Transient Factory has been using machine learning in order to detect visual transient events. These are things like streaking objects or supernovae.
They have aspects of continuous quality control and retraining. How this works is, it takes on the order of 10 to the third objects that are seen every night in the dataset, and it triages them down to 50 that are then suitable for human review. See the results below. 👇

VLBA and V-FASTR
Work in computer vision doesn't just apply to the visual domain, it actually applies to the radio astronomy domain. Machine learning is used to automatically triage radio transient events that are correlated across multiple radio telescopes all around the world. 👇

One of the greatest achievements here is the Very Long Baseline Array (VLBA) and the Fast Transients Experiment (V-FASTR). They use Random Decision Forests in computer vision techniques, continuous quality control, and retraining. Machine learning and computer vision have a long history of dealing with very large datasets.
Deep Mars CNN
These kinds of techniques are also used to automatically classify data for images acquired by the Mars Science Laboratory rover. This has been on Mars for about 10 years. 👇
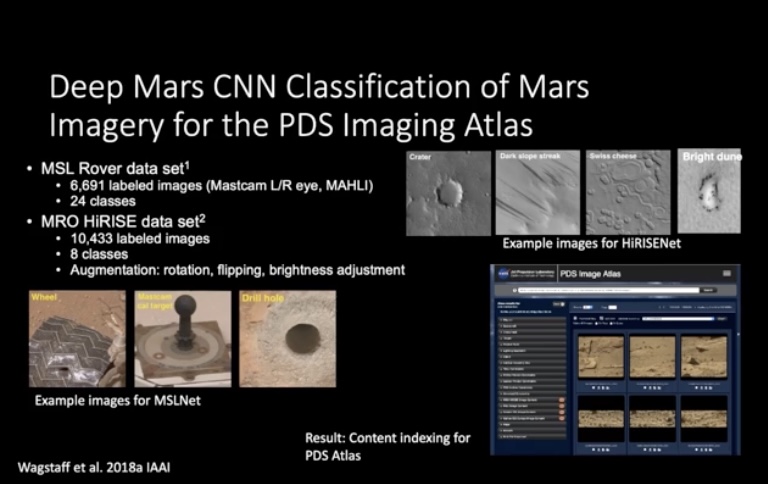
It automatically triages this data into different categories for what's called MSL net. For engineers or engineering purposes, it figures out where to drill holes, wheels, and Mas cam calibration targets.
There’s also remote sensed imagery from the Mars Reconnaissance Orbiter, which is one of the highest resolution cameras orbiting Mars. They’ve trained machine learning to index images and to classify different things like craters, dark slope streaks, swiss cheese, and bright sand dunes.
Moving analysis to the edge
One of the things that we're very excited about is moving the analysis to the edge. We’re talking about putting the analysis onboard the platforms that are acquiring the data. This is so vital because then they can make decisions based on what they see.
Earth Observing-1
In 2003, we actually put these kinds of classification software aboard a spacecraft called Earth Observing-1. It’s pretty obvious what this does, right? It looks at the earth and sees different kinds of scientific phenomena. Here’s a model of what it looks like.

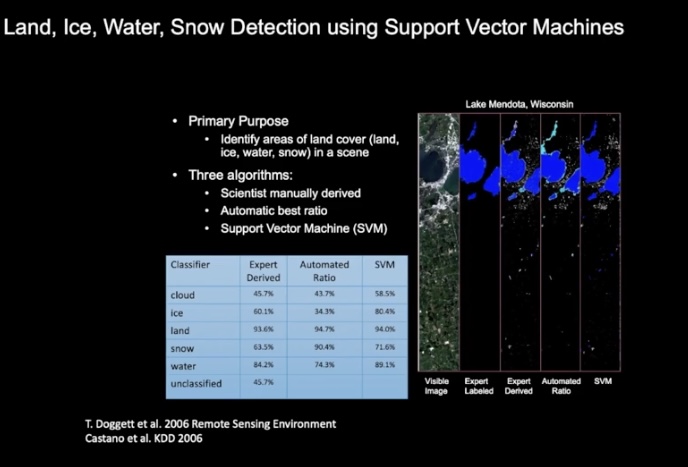
Support vector machine learning
We use support vector machine learning techniques to automatically interpret images to look at clouds, snow, water, ice, and land. This allows us to track the growth in retreat and the freezing and thawing of the natural world. This serves a pretty important purpose for a crucial modern-day issue: it can determine ice breakup or measure glacier sizes.
Cloud detection
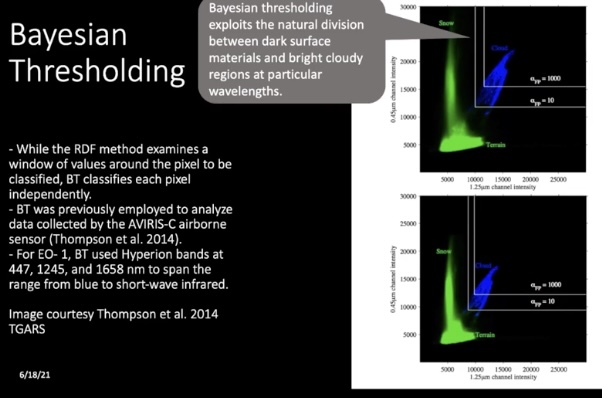
Bayesian thresholding techniques
This automatically discriminates between clouds and non-clouds. Typically, in the middle latitudes, about two-thirds of each image is cloudy. Oftentimes, that's not what the scientists want. Solution? You can compress the heck out of that part of the imagery.
TextureCam
You can also carry out cloud detection using a system called TextureCam. This is a technology that uses Random Decision Forests. This is from the Ipex CubeSat.

Hyperspectral analysis
This is the most powerful image processing that we've done. Below we're going to break down the various aspects that make it work. 👇

Superpixel segmentation
Here, we're using superpixel segmentation. How this works is, we're taking areas that are similar, and blending them into larger pixels to increase our signal-to-noise ratio.
Sequential maximum angle convex cone and number extraction.
I know what you’re thinking. It’s a mouthful, right? But what does it mean? Well, our eyes see the world in three spectra: red, green, and blue. We can build these instruments that can see the world in hundreds of different spectra.
For each pixel, they actually read out 100 values. That gives us a curve, which is the equivalent of the color, only it's now a 100-dimensional space. Because we can see these very subtle spectral differences between these objects, we can tell the difference between the different substances we are looking at.
Repeatability maps and detections
See those green, red, blue, and purple squiggly lines? Well, they might look like just squiggly lines, but from the shape of those curves, we can actually detect whether those signals relate to Calcite, Muscovite, or Alunite. 👇
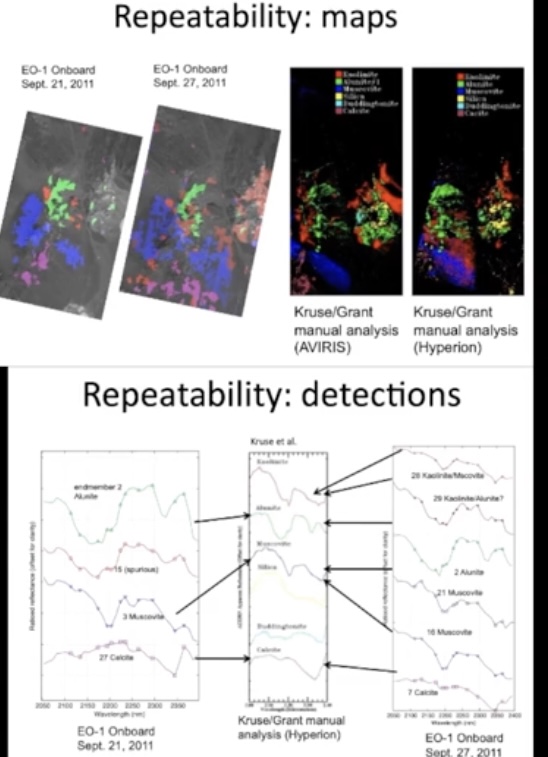
This was pretty groundbreaking work because it showed that we could do the same analysis on board the edge as the revolutionary manual analysis done by the great pioneers of the past.
AVIRIS-NG Methane Source Finder
This is the use of deep learning techniques in order to find spurious methane sources. They can fly an airplane over and take photos with one of these fantastic imaging spectroscopy cameras. They do this to detect very faint methane plumes from methane source emitters.

These methane emissions are typically the result of oil wells leaking.
Comparing different data
Oftentimes, we can compare multiple kinds of data in order to get what we want. See some examples below. 👇
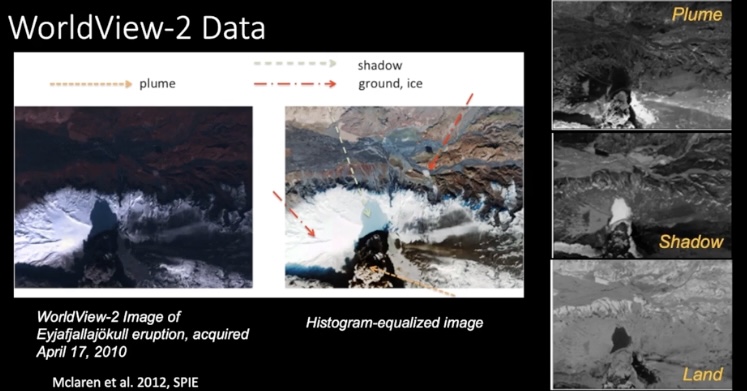
Worldview-2 Data
Here we have some data taken by the Worldview-2 satellite of a volcanic eruption in Iceland. We've used a Random Decision Forest classifier and the TextureCam classifier to show the difference between plume, shadow, and land.
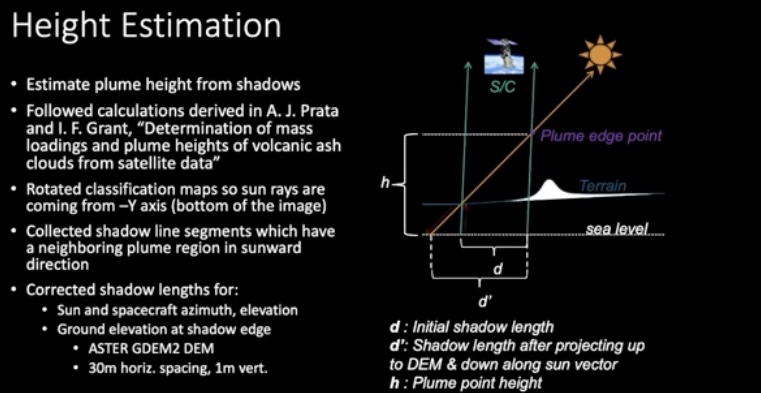
Height estimation
We can then take that plume, shadow, and land information, as well as information we know about the position of the sun and the spacecraft, and we can estimate the height of the volcanic ash plume.
Scientists really want to know about what's called the plume injection height. It provides great insight into how vigorously the volcano erupts. From the data in these images, we can determine how vigorously the volcano is erupting.
Computer machine learning on Mars
Active rovers have been very aggressively using machine learning and computer vision on Mars itself. Take a look at some examples below.
MER study of dust devils
Mars exploration rovers in 2007 used automated processing to actually detect and track dust devils. Dust devils are incredibly interesting because they’re actually atmospheric activity on Mars. They can be as large as kilometers in height, but they don't happen all that often. You can take all the images you want, but you still won’t necessarily see them.
Instead, what we wanted to do is develop a technique to automatically detect and track dust devils. And we did just that!
MER– dust devil tracking
The red boxes at the top of the image below show these detections. And we do this by simple motion tracking and temporal differencing across a series of 20 images.
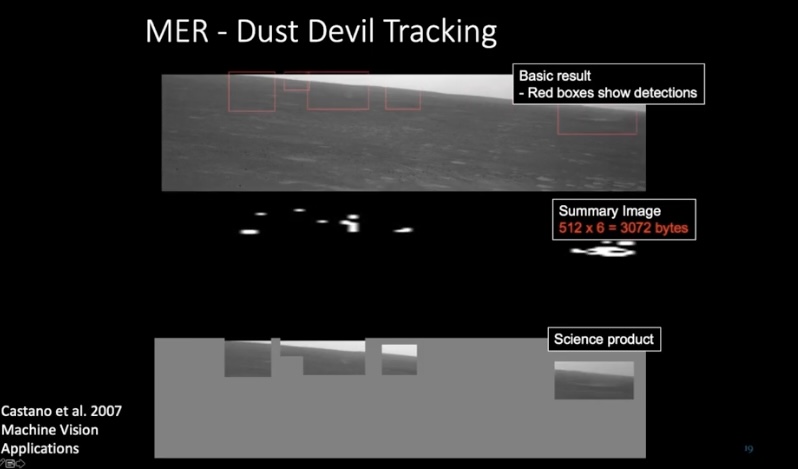
We then actually produce summary images that extract out the size of dust devils. Scientists are interested in how often dust devils occur and how strong they are. From these images, scientists can potentially detect the velocity and strength of the dust devil. In other words, how opaque is it?
What we actually produce in the bottom image is the science product. This is a cropped out series of images with the dust devils extracted from them, and the rest of the image we gray out. The image compression techniques can compress the uniform gray pretty well.
MER study of clouds
When we did this, we also developed a technique to automatically analyze the clouds. It turns out the scientists are very interested in what type of clouds form. Below are some images of how we detect these clouds. 👇

We can downlink summary products on these images so that scientists on the ground can tell what types of clouds we’re looking at and why they formed. We do this by finding the sky, which is obviously a very homogenous region, and then looking for variations within that.
Eventually, we'd like to have these techniques for dust devils in clouds. We’d like to be able to downlink the statistics on when the dust devils occur and see how strong they are. This is in fact the important information that the scientists want.
Autonomous targeting using computer vision
This is an incredibly interesting and vital topic. We’re going to focus on a particularly fascinating system called AEGIS. Its most stunning application has been on the Mars science laboratory Curiosity rover.
AEGIS system
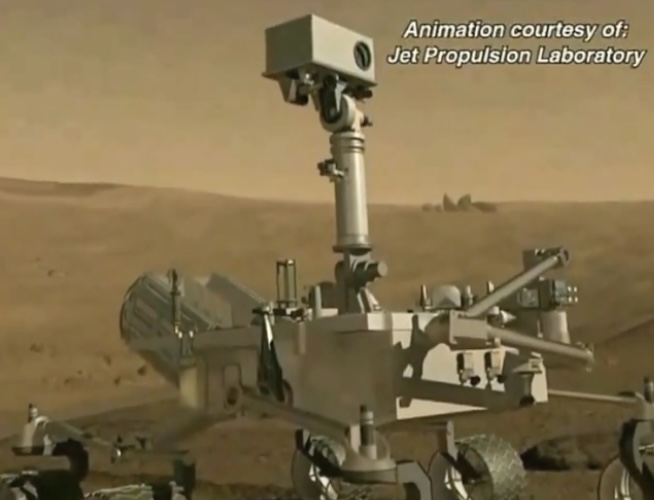
And what it does is find targets for the ChemCam laser, also known as a laser-induced breakdown spectrometer. If we look at images of Mars, what's common about them is that they're all covered with this rust-colored dust. If we went and measured that all over Mars, we wouldn't be very happy because it’d all just be iron oxide dust.
But those clever scientists found a way to fix this! This laser-induced breakdown spectrometer fires a laser that burns off the outer coating of the rock that's been weathered with this dust. It then measures underneath that dust and determines what the underlying rock is.
The problem is that it's a very small laser, and it takes a significant amount of energy and works to fire it. What the scientists used to do was take an image of a region, download an image to the ground, and figure out where the targets were in that image.
They then figured out where they wanted to target the laser and formulated the commands to target the laser. They would upload those commands the next day, fire the laser and get their data.
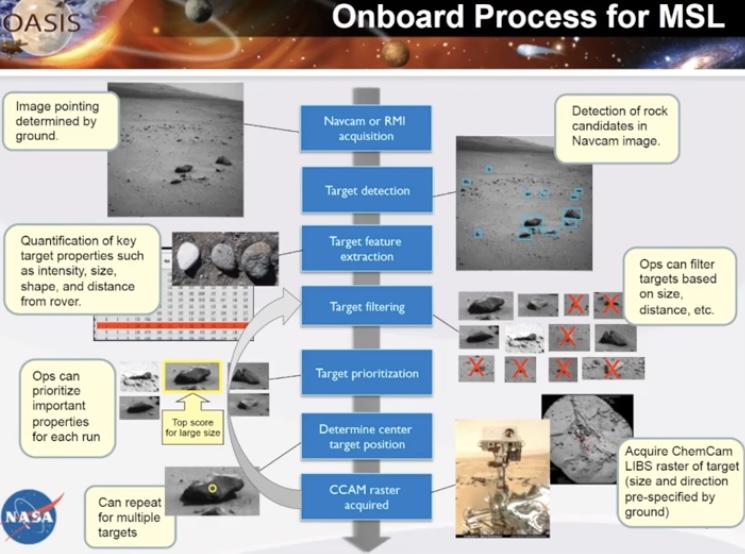
Process for MSL
Nowadays, what we have is a system that automates that process. It takes a NAB cam panorama and extracts the candidate rocks. The scientists give a set of criteria that they'd like to choose: intensity, size, shape, distance from the rover.
They can then specify how to filter the targets based on these criteria. They can hit up to three targets that are greater than this threshold or hit the highest value target. From that, the image processing software automatically determines the center of the target, as well as the distance to the target using stereo.
This is a tremendous boon to the science on the rover. Here’s a breakdown of the onboard process for the MSL. 👇
Dynamic targeting: SMICES ice hunting radar
This is another example of the kind of autonomous dynamic targeting we'd like to do. For this mission to work we’d have a spacecraft flying over the earth. We’d then use machine learning to learn a classifier for deep convective ice storms. As the spacecraft is flying over the earth, it looks ahead with its radiometer instrument and tries to find these deep convective ice storms.
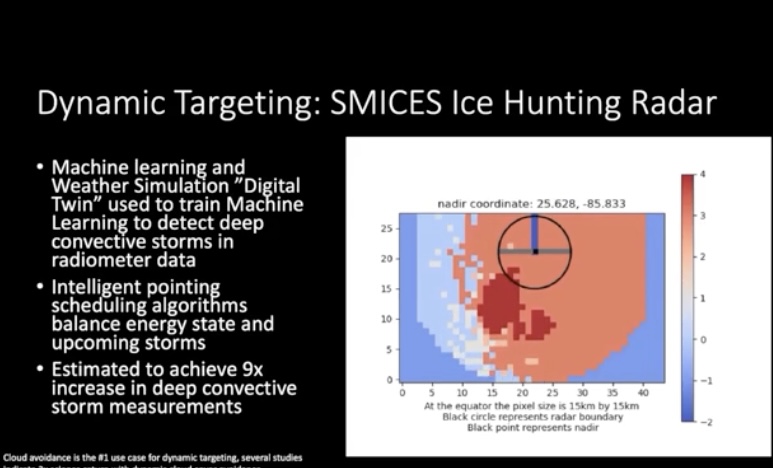
These deep convected ice storms are found in the darkest reds on the image above. It has a radar that it can turn on which can then target the darkest reds. It takes a lot of energy to take these measurements, so we're saving the radar for the most important science targets. This allows the mission to be much more energy-efficient and much more target efficient.
We get better science and a better bang for the buck!
Broad sweeps vs targeted sweeps
This kind of smart targeting is not just on Earth and on Mars. We work on this fantastic European Space Agency mission called Rosetta, which is where we studied a comet. For this, we had to plan out these activities weeks or months in advance. We wouldn't know if the comment was going to be out these plumes like the dust devils on Mars.
MIRO
What we'd like to do is have this narrow field of view instrument called MIRO. It’s a microwave instrument that tells us about the composition of the gas and the plume. But since we don't know exactly where the comet is going to be and where the plume is going to be weeks in advance, we just did these broad sweeps across the whole area.
That leads to us getting a lot of data, but we don't have a very good temporal evolution of the data. We'd like to do a targeted sweep across one of these plumes. We’d like to track its evolution as it rotates into the sun, honing in on the plumes as they form and disappear.
Plume Detection Rosetta (OSIRIS)
We developed machine learning techniques to do exactly this. This is a sequence of about 12 hours of data. Each frame is about 20 minutes apart. And as you can see in the image below, those lines are tracking the plumes using edge extraction. We could track the plumes and take those targeted measurements that I'm talking about.

Computer vision in the search for extraterrestrial life
I’m going to finish with a topic that's really near and dear to my heart. If we send the mission to one of the outer planets, let's say one of the moons of Saturn, we are going to have to be very efficient in the data we bring back because we're sending it from billions and billions of miles away. It's very hard to send that data.
We've been looking at machine learning techniques that would enable us to do that. One of these is called ‘unsupervised learning.’
Unsupervised learning
Consider the following experiment: when a summer intern was flying across the country, we had them take hundreds of images out of the side of the airplane. We then clustered those images according to certain visual features, and then we tried to classify them using unsupervised learning. It turns out, if you have the right features, you can create clusters, such as clouds, oceans, plains, and mountains.
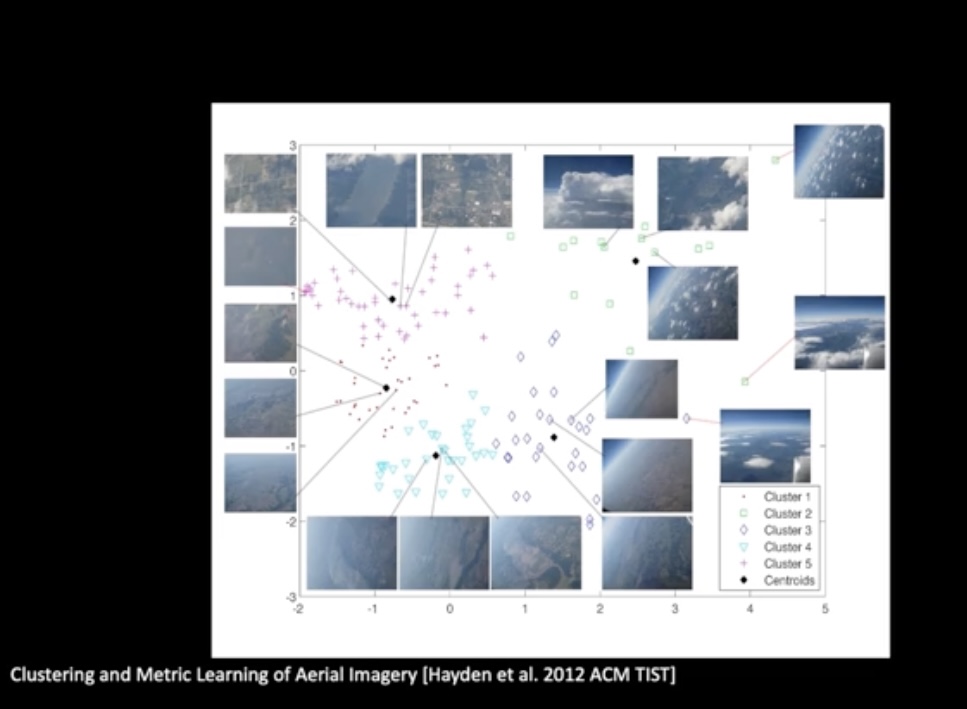
What we want to do is take those clusters and have them act as ‘keys’ to our map. This is a tremendously efficient way to send data.
Further resources
For further information, please visit us using the following links:
ai.jpl.nasa.gov
ml.jpl.nasa.gov
dus.jpl.nasa.gov
Interested in the whole presentation? Download Steve's slides below:


AI accelerator insider insider
Thank you for subscribing
Level up your ai accelerator insider career & network with ai accelerator insider experts.
An email has been successfully sent to confirm your subscription.
 Follow us on LinkedIn

