
Data-driven decisions are ubiquitous. Every type of industry requires explanations for the data-driven decisions from chemometrics, econometrics, neuroscience, bioinformatics, computer graphics, and surveillance technologies - they're everywhere.
At Tensor Vision, we argue that developing causal explanations for correct results or for failures from mathematical equations and data is important in developing a trustworthy AI and retaining public trust. We've been developing a causal data analysis pipeline that is data agnostic.
This article will go over:
- Causal explanations for data-driven decisions in a Tensor framework
- Causality: a misunderstood concept
- Causal inference
- The importance of modeling a causal mechanism
- Data acquisition and causality
- Global representation vs. hierarchical representation
Interested in seeing more? Download Alex's presentation below.

Causal explanations for data-driven decisions in a Tensor framework
The “right to an explanation” statute
As a result of the amount of data-driven decisions, the EU has passed the General Data Protection Regulation, which is a set of laws governing decision-making by complex algorithms.
Legal scholars have interpreted this particular legislation as including a right to an explanation, meaning that the algorithm has both a right and an opportunity to be heard, and gives humans the opportunity to contest the decisions of an algorithm.
Open Data Initiative
In the US, local and federal governments joined the Open Data Initiative, making data access available to everyone in order to have a transparent government.
In order to make transparent government truly transparent, data needs a set of tools that enable data scientists, journalists, and citizens to analyze public resources, question public policy, and discover hidden knowledge useful for social, scientific, or business initiatives. In order to be meaningful, these tools have to be delivering causal explanations.
Causality: a misunderstood concept
Causality vs correlation (association)
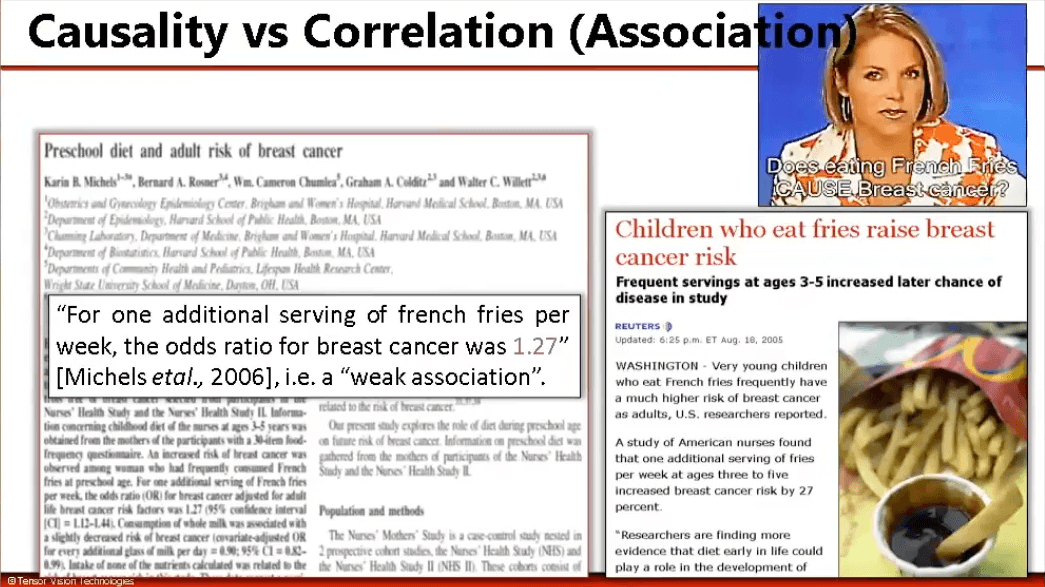
Causality is often confused with correlation. For instance, there was an article that discussed the preschool diet of children and the likelihood of risk of breast cancer as an adult. It reads: “for one additional serving of French fries per week, the odds ratio of breast cancer was 1.27”. That means a weak association.
Katie Couric, a journalist in the US, has asked the question: “Does eating french fries cause breast cancer?”. Walking an incredibly thin line, she's not saying that it does cause cancer but she's simply asking the question.
On the other hand, Reuters completely gets it wrong. They say: “Children who eat french fries raise breast cancer risk”. Well, if it's just simply two variables that are associated, not causal, you cannot increase the breast cancer risk, because they're just associations and not causations.
Causality vs prediction (common cause)
Another article has discussed how likely a couple is to get divorced, based on the way they spoke to one another. They have longitudinal clinical studies and based on the type of vocal acoustics, they could predict things very well.
Now, prediction doesn't necessarily mean causation. If you're speaking to your spouse in a disrespectful manner, if you're speaking loudly, that may be because there's infidelity in the marriage, or because there's financial problems.
They have a common cause; they impact the likelihood that you're going to be polite to your spouse, or rude or aggressive in your manner of speech and the likelihood of getting a divorce. These common causes impact these two variables: the way you speak to one another and the likelihood of getting divorced.
The public popular press gets this concept wrong and concludes that if you just speak politely to your spouse, you're not likely to get divorced. Well, no matter how politely you speak to your spouse, if there is infidelity in the marriage, it doesn't mean you have somehow made your marriage “divorce-proof”.
Words matter
Now, you might think, it's probably the press getting things wrong, but it can happen even in scientific circles. For example, there's a scientific article that clearly states in the abstract: “We are evaluating the association between mortality and out-of-hospital hypotension and hypoxia, separately and in combination”.
It’s an association, so not a causation, we are evaluating the association between mortality and out-of-hospital hypertension and hypoxia. However, the title uses causal language: “the effect of combined out of hospital hypertension and hypoxia on mortality”. You can only have an effect if those variables are known to be causal.
A contributor to the Scientific Journal states there's a history of medicine that illustrates the harms of misconstruing association as a causal relationship. This particular author points out that women have been prescribed estrogen replacement therapy, in the belief that it would improve their cardiovascular health, because there were associations from observational studies. In fact, when they did causal studies, they found out that not only does it not improve women's health, it actually increases their cancer risk.
Given all of these problems, it's not surprising the field of causality has been treated with some disdain by many scientists.
For example, Karl Pearson referred to causality as a ‘fetish of modern science’ in the 1800s. But even as late as the 1990s, Terry Speed said: “causality should be treated the way it's always been stated in statistics, preferably not at all”. Bengt Muthen has said the research should “abandon thinking and using terms as cause and effect”.
Causal inference
Causality is the relationship between two events A and B, where “A causes B” means “the effect of A is B”, a measurable and experimental group but repeatable quantity.
Causal inference is the process by which one uses data to make claims about the causal relationship. The causal field has three areas: forward causal inference, inverse causal inference, and causal mathematical modeling which sustains these two areas of research.
Forward and reverse causal inferencing
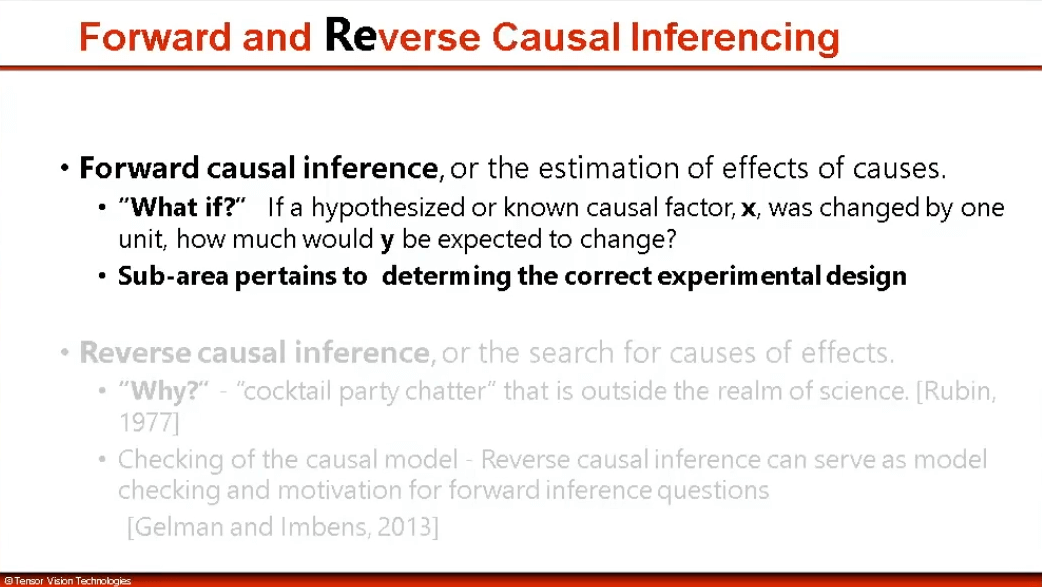
Forward causal inference is the estimation of the effects of causes. Ask the question: if a hypothesized or non-causal factor X was changed by one Delta unit, how much would Y be expected to change? If X is indeed a causal variable of Y, then every time you change Delta X, you would see a Delta amount change in Y.
A sub-area of forward causal inference pertains to determining the correct experimental design, meaning how do you collect data such that you can make causal conclusions?
A reverse causal inference, or the search for causes of effects, was also known as the ‘why question’. In 1977, Donald Rubin referred to it as a “cocktail party chatter that is outside the realm of science”. Since then, his thinking has evolved. His former Ph.D. students have softened Donald’s stance and referred to reverse causal inference as a way of checking the causal model and as a motivation for the inference question.
One of the main dictums of causal inference says “no causation without manipulation, treatment or intervention”. You either have a physical intervention in the real world or you have an intervention on the model, meaning you’re doing the counterfactual, and only then can you derive causal explanations.
As an example of causal inference, a facial image is the compositional consequence of several causal factors: scene structure (meaning the overall geometry is also the result of the person's age and expression), illumination, and camera.
This is known as the forward causal model, but often we're interested in the inverse causal model. If you develop the forward causal model, by modifying each causal factor in turn and developing a forward causal model, in order to compute the causal factors from an unlabeled data set, you have to invert the forward causal model.
There’s been some misunderstandings about this in machine learning and people have often taken unsupervised data, unlabeled data, and ran algorithms that have predicted causal values. Prediction is not the same thing as causation.
In any causal factors, one computes from unlabeled data without inverting the forward causal models might get you causal explanations but there are no guarantees to it. Any causal explanations are if they happen to be true, purely coincidental and it's important to develop the forward model first and then invert it.
Answering the “why question”
There’re many different ways of answering the question “why”, and each one of these why questions imply a different experimental design, grabbing data off the internet and hoping to be able to answer any of these why's in a way that guarantees they're correct is very difficult. You need to have captured data in a systematic way for each one of these questions and you can address each question separately or together.
The “why question” requires context and a forward causal model provided. Every one of these “why questions” have a slightly different experimental design, meaning a slightly different data acquisition involved.
Visual illusions
One of the reasons why Donald Rubin has referred to the “why question” as a cocktail party chatter problem, is often because the same set of causal factors, different combinations of them give rise to exactly the same image or the same output. In computer vision, this is known as visual illusions.
Two different geometries can give rise to exactly the same image. Often, these visual illusions can be broken if you have an additional image from a different viewpoint or different illumination. The human visual system is remarkably robust to these types of problems, but when they happen, we really find them compelling.
Inverse causal inference
Rather than using the word reverse causal inference, we defined it as inverse causal inference. We provided a mathematical specification for the “why question”. Rather than saying that we're computing the reverse causal inference, we're computing the inverse causal inference, meaning we're estimating the causes from a set of effects given the forward model that we invert, plus a set of observations that constrain the solution set. This way, we make the problem well-posed.
The importance of modeling a causal mechanism
Knowing vs understanding
People might often think, isn't it enough to have a prediction model that is very accurate? Why do I need a causal explanation? Why does that matter? It’s important to model the mechanism that has generated the data, rather than merely computing a set of predictions when something is true or not.
Traditional statistics vs causal inference
Traditional statistics and traditional machine learning are about associations; you’re modeling the distribution of the data, you predict given observations given two variables that may be causal, or may just simply two variables that are associated with one another, you predict one from the other. For example, you predict how likely someone is to get divorced based on the acoustics of their speech rather than modeling the mechanisms.
Causal inference by comparisons about causation, you're modeling the mechanism that generated the data, and you predict results from interventions. You have to do an intervention either in the real world or on the model itself.
Natural images
Natural images are the composite consequence of multiple constituent factors related to scene structure, illumination, and imaging.
Multiple linear algebra, the algebra of higher-order tensors, is a transparent framework that facilitates the analysis of the causal structure of image formation.
Data acquisition and causality
A causal relationship between observed data and the causal factors can be learned from a set of training data, which is acquired by varying each causal factor in turn while holding the rest fixed. Of course, the best evidence for causation comes from randomized comparative studies.
What do I mean by data acquisition? In the case of facial images, you have a person and you are varying the viewpoint systematically, and for every viewpoint, you vary the illumination and this data set can be organized into a data tensor.
Tensorfaces → facial signature
After you've acquired this type of data, you perform a tensor decomposition that decomposes the image in terms of the person parameters, the illumination parameters, and the viewing parameters. Every image contains information, by using the M-mode SVD, you can now get back the latent information that represents the person, the viewpoint, and the illumination.
Statistical invariant representation
For example, you have one woman and a tensor decomposition that you have computed from training data. You have variances in viewpoint, people, and illumination. This is multiplied by an illumination representation, a view representation, and a person's signature.
No matter how you change the illumination and the viewpoint, the person's signature never changes. It’s a statistically invariant representation of all the other causal factors, and when you have multiple images, every image has the same personal representation, but the only thing that differs is the viewpoint. Every row is a different viewpoint, representing these images.
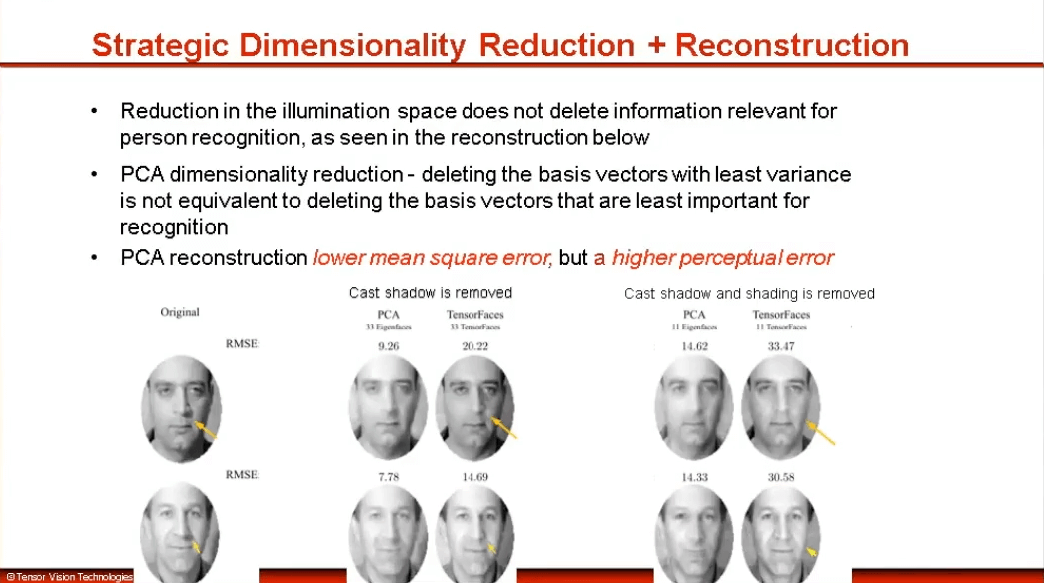
Strategic dimensionality reduction + reconstruction
When you have this type of decomposition, you’re literally taking an image and decomposing it into the causal factors. Let's say you have removed the elimination information. Is it really statistically invariant? Is the elimination representation truly just capturing elimination information? Or will it have an impact on the rest of the data?
We've looked at different types of data, we've done a dimensionality reduction elimination representation and we've noticed that from the original image, the only thing that was missing, when we reconstructed the data, was the shadow we can overhear. We lost the shadow and the shading.
There's something very predictable about doing tensor factorization, tensor factor analysis. You can throw out information that is strict with a particular causal factor that gets in the way of doing some specific task. In this case, illumination does hide a lot of the facial features.
Expression/face multilinear (Tensor) transfer
Another example is when you have a unique representation of the person, you can also change the expression at will by taking the expression from someone else and this is one of the things our colleagues have done in the past.
You take the images and you decompose them into the person's representation and the expression, that way we're able to map the expression of one person onto another.
It can be done for entertainment, but it can also be fake data and can also cause some problems in society.
TensorTextures
This type of decomposition isn’t going to be used just simply for mischief, but it can be used for meaningful tasks in computer graphics. Often in computer graphics, if you want to generate a five-minute computer graphics video clip, it can take up to a month to render.
One of the things computer graphics scientists do is approximate coarsely some pieces of geometry. For example, imagine a tree trunk that can be coarsely approximated by a cylinder, and then you want to map a texture around it. You can sort of get rid of geometry complexity, and you just want to have the correct texture onto the data, you want to have everything appear correctly.
Global representation vs. hierarchical representation
Scene structure
All the discussion we've had so far has been about global representations, but often we find ourselves with not enough data, or acquiring data in a thoughtful systematic manner is expensive. However, you can acquire a small data set and you want to leverage that data set by creating a counterfactual model that allows you to represent more information.
For example, you can change the viewpoint illumination for an object like the face, but you also realize the object really is made up of a recursive hierarchy of parts and holes (eyes, eyelashes, nose, mouth - all of these things make up a face). If you could just represent the eyes, nose, and mouth separately, and somehow combine them together to represent your data, it can be much more effective.
Hierarchical part-based OR region-based subdivision
For example, we would like to decompose the image in terms of the eyes, nose, and mouth. Rather than representing the entire face, you want to represent each piece and then somehow combine them together.
Normally, you take your image and vectorize it, people by viewpoints and another axis by illumination, and then subdivide it into parts. But in reality, you need to do a little bit more because you get information from the whole as much as you get from the parts. The whole can give you information such as somebody's gender or somebody's age.
To do this, you can decompose the data, split up the pieces, and then add them up together so you have a bunch of identity matrices, a way of adding them together you can represent them. Decomposing and representing your data tensor into a hierarchical data tensor is simply a way of rewriting it such that when you multiply with the identity matrices (which are basically a weight type of addition) ends up being exactly the original data transfer. Because you're separating them into pieces, you can now have hierarchical variants, viewpoints, and people illuminations for each individual part. Therefore, you have a signature for every single piece of the face.
This is known as a hierarchical block tensor face and it's very similar to what you currently see in machine learning and in deep learning where you have these low-level features, mid-level, and high-level features.
Human motion, 3D sound, fMRI…
Tensor acquisition and decomposition can be applied to a lot of types of data, for example, human motion. You have people by activities, by joint angles over time, where the people could have a normal gait, or some kind of pathology, have the person walking, going up the stairs, down the stairs, and looking at the different joint angles and computing a human motion signature for every different for different pathologies.
You can do it for computer graphics, learning the Charlie Chaplin style in walking, and you can transfer that style, doing a different activity that you haven't seen, going up the stairs, down the stairs, you can imagine taking Charlie Chaplin's walk and decompose it into the style versus the activity itself.
You can also look at 3D sound by placing different speakers in different locations, and capturing that information as it arrives in your ears. This will help you create a surround sound system or a way to use this information to navigate an environment. This is not just simply for entertainment, but it also can be used for neuroscience and looking at brain signatures and fMRI data over time.
In terms of human motion, imagine if I have a stiff knee and my knees simply won't bend, then the angle is always zero. Otherwise, from one person to another is pretty much the same thing: you're bending the knee, you're extending the leg, so it's always the same motion but the difference is how much of an angle you're performing. How much are you swinging your hips, how much are you bending your knees or don't bend your knees, that really makes the entire motion signature? You extract the signature from the walk and you map it going up the stairs.
Final words
Ultimately, correlation does not imply causation, and neither does prediction. Causal explanations are very important for scenarios in medicine or in security with surveillance technologies. There are certain types of information for which you can’t simply use prediction; you need a causal explanation.


AI accelerator insider insider
Thank you for subscribing
Level up your ai accelerator insider career & network with ai accelerator insider experts.
An email has been successfully sent to confirm your subscription.
 Follow us on LinkedIn

