
My name is Chetan Trivedi, I’m Head of Technical Program Management (AI & Big Data) at Verizon Media.
In this article, I’ll talk about four hand-picked Verizon AI solutions’ machine learning use cases:
- Cellular network performance prediction
- Threat detection system
- Traffic prediction
- IoT anomaly detection
Let’s get started 👇
Cellular network performance prediction
Verizon has multiple cell towers (which have an antenna and the base station) in different geographic locations and we’re collecting multiple parameters on a daily basis from those base stations.
Those parameters are impacting some of the key KPIs of the quality of service parameters, such as bearer drop, SIP, and handover failure. That can cause someone to lose connection while on the phone or when trying to transmit data.

The global market size is $9 billion. We are not saying Verizon is making $9 billion, but it's an overall size for the particular use case where we’re trying to save money for the company, or we’re trying to retain the customers because of the superior performance of the network.
We’re trying to solve a couple of key things:
- How to optimize the base station parameters in the best possible way? The current way of doing things is manual where network operators make random changes to the parameters and they try to bring those KPI values inbound. However, there’s a possibility of a lot of errors with this manual work.
- How to best predict the base station parameters for the next day or the day after so it's fully automated by using ML concepts.

The data flow is some of the key features we’re trying to use. There are many more features but some of the key features are indicated on the left: eNode sector carrier, Parameter name, Parameter values, and KPI data.
KPI historical data values are very important because we’re trying to take in the historic values and try to predict the new value. Output on the dashboard will be more like a predicted KPI value. Current use cases are just focused on these three values (Bearer drop, SIP, and handover failure) to be predicted.
The platform is more like a big data platform collecting all the data from different base stations. It's doing the regular data processing stuff, the supervised learning, and the regression algorithm.

Deep diving into this, we have several tried and tested regression algorithms, some of them are linear regression to gradient boosting algorithms to random forests.
The best model is selected, we do the standard stuff, train the data set and come up with a predicted value. We compare the model outputs and see which one is behaving the best and so far the model has predicted the best value is 0.11, which is the mean absolute error for the regression model.
We’re still working on it and we want to minimize the error as much as possible to make sure our model has the best value possible.

To give you an idea of how the antennas and their locations actually look, this is geo-fenced by a certain region and the way it is shown here is the current 4G LTE antennas are three leaf patterns. The ones with the circle are omnidirectional antennas, which are more like an OLED.
On this UI, you will be able to see all the optimized parameters once the model output is shown. There are many other screens where you can see the optimized value, that’s the output of the model.
Threat detection system
The next use case is in line with the threat detection system. I'm specifically focused on the DDoS use case and this particular scenario occurs when multiple machines are trying to attack a particular IP address or a site and make it non-functional.

The global market size is $50 billion. We're trying to address how to best detect the threat in real-time when it's happening and how to mitigate the threat.

Some of the key features here are the source and destination IP address, source and destination ports, IO bytes and packets, and source IP counts.
Source IP count is a very important feature because multiple sources are attacking a particular IP address and that’s the reason it’s one of the key features.
The output you'll see is mainly anomalies detected by the model, which is by a router and by an interface. If I were a security analyst, I would like to know which particular router and our interface are compromised or can be a potential threat. It may sometimes be a false positive so we have to make sure our model is accurate in a way it's trying to mitigate the false positives and trying to reduce those numbers.
In the middle, we see that it's mainly time series data and sample learning, those are the key things we have used here.

We‘re collecting the data from networks and routers, and this data is collected under the Data agreement with the particular customer giving us permission to collect the data from their assets.
We start monitoring the network and the router for that particular customer and for those assets, and the data sets are coming in at different intervals. One is the SNMP data, which is the network data and another is NetFlow which is periodic one-minute data.
This data is labeled so we know that on a given particular day because this is based on the past attacks that have been in the system, those are flagged and labeled as an attack. It's supervised learning we’re trying to do and it has a real-time threat detection capability and ensemble learning.
Since there are multiple workflows, we’re trying to take the flow from those multiple classifiers and try to declare it as whether it's a real threat or not, that's the reason we implemented ensemble learning to make it more robust. This particular system has detected all the major attacks so far.

This is one of the attacks, which was on a particular given day, and you can see the packets are going high. When the packets are going high, that means there’s a lot of activity going on, and this is a potential threat.

This is a screenshot of one of the typical UIs any cybersecurity or network analyst will see. On the left is a list of routers (gateway router and broadband router). On the middle panel are the interfaces that are vulnerable or under threat. On the right side are the key features by which we declare whether it's a real threat or not (bytes and packets).
Traffic prediction
The third use case is traffic flow detection. We’re trying to detect the traffic flow and congestion patterns on a given intersection or street.

This is a global market size of $27 billion. This number is very conservative, there’s more potential here.
One of the things we’re trying to address is traffic flow monitoring. That's a key requirement from the cities, what is the best possible way to monitor the traffic at a given particular intersection to minimize the commute, and congestion and avoid fatalities?
The second aspect is vehicle speed which contributes most to the fatality of pedestrians or cyclists and the third one is the safety of pedestrians and cyclists.

There are multiple video nodes mounted on a particular given intersection or street in the city collecting key information. There are many other parameters, but the key parameters we’re collecting are vehicle speed, location details, vehicle count, and pedestrian counts.
The platform has two components: image processing and anomaly detection at the tail end. The dashboard will also show the vehicle count, max, and average vehicle speeds because those fields are the key parameter that will give us insights into how we can prevent more fatalities caused by vehicle speeds.

Traffic flow activity is captured in real-time by multiple video nodes and uploaded to the platform for image processing. Slices of video are taken and converted into images, from those images the algorithm detects the object (it can be a pedestrian, cyclist, automobilist, or bat).
That information is sent to the anomaly detection model, which is collecting the key attributes and making the determination of the anomaly on a given time or day.
The processed data is fed to the model and the anomaly is detected by the anomaly detection system. Based on the detected anomaly CT personnel can assess the dashboard and make a judgment call on whether they want to optimize the timings of the light at a given intersection, or how they fully manage the traffic flow in and out of that particular intersection.

This is a screenshot of one of the screens. On the left side, there are multiple video nodes, which you can zoom into. You can see the average and maximum speed on the right, which is at a particular given time, here it’s 12pm. Down below is the heatmap of the vehicle count on a given hour and you can do it for the entire week or for the entire month.
This is how the person doing analysis on this traffic can determine whether they need to adjust anything in terms of the traffic light or take remedial action to make it freer flow and smooth.
IoT anomaly detection
The IoT anomaly detection here is an intelligent vending machine. Under the Data agreement, they send the data to us (this is network-level data) and the goal is to detect and identify whether their IoT devices are healthy or unhealthy.
If they’re flagged by our model as anomalous, it doesn't mean they’re really anomalous, but we are trying to minimize the false positives by making sure that our model is robust.

The global market size is $12 billion for the intelligent vending machine space. We’re trying to address the device anomaly count. There are multiple categories, such as network RF, by which we’re declaring it as anomalous or not. That's where the middle block comes in, the anomaly type, so accordingly, the IoT analyst can take remedial action based on what category it is. The third one is anomaly severity, whether it's a critical, high, or medium kind of severity level. Based on that, the IoT analyst can determine whether to take action now or later.
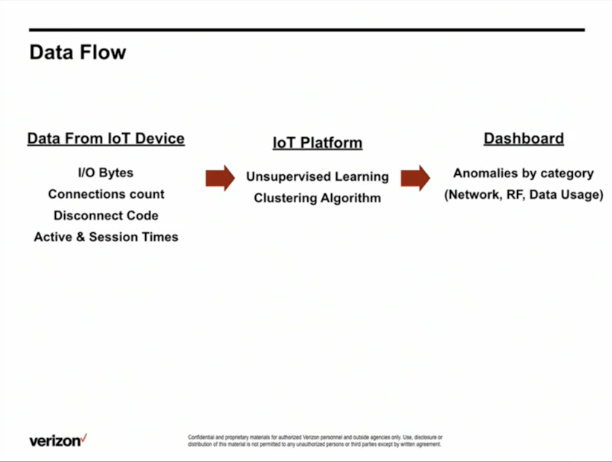
On the output side, we have the anomalies which are by category (network RF, data usage). What we're doing is in a big data platform. We have unsupervised learning because the labeled data set is not available. When the new data points are coming, we’re running the clustering algorithm on top of that and making sure that we group the devices by their behavior.

Critical network data comes to the platform and scalable machine learning algorithm, which is in this case unsupervised learning. It runs on a collected data set and then groups of devices are clustered based on their behavior. The fine-tuned model is deployed in production at scale and it's trained periodically. You have to keep the model training and make sure it's not out of date so it detects and minimizes false positives.

In this screenshot, we can see that 0.12% of the devices are anomalous at a given point in time. They are identified by categories at the bottom and also they’re declared as critical, high, medium, or low.
This is real-time information that IoT analysts can see and take remedial action right away based on what they’re seeing on the dashboard. Being able to take quick action avoids the loss of business.


AI accelerator insider insider
Thank you for subscribing
Level up your ai accelerator insider career & network with ai accelerator insider experts.
An email has been successfully sent to confirm your subscription.
 Follow us on LinkedIn

