From a very young age, you learned how to crawl, walk, talk, and eventually do a variety of tasks. Though, the intriguing thing is, you didn’t learn how to do these tasks immediately; it took some practice, diligence, and resilience to fix your mistakes and eventually get to your goal.
However, that’s not something to be ashamed of; everyone makes mistakes, even machines.
Wait, what? Machines?
Yea, machines!
In this article, we'll go over:
- What do you mean machines can learn?
- Can machines only classify?
- 7 steps to success (in Machine Learning)
- But…how can it learn to do a specific task?
- Wow! I can’t believe it!
What do you mean machines can learn?
This trait of machines derives from a truly fascinating concept called machine learning. It enables machines to perform specific tasks more efficiently than humans by gaining knowledge from their experiences.
Let’s look at a simple example:
Pretend you’re a baby and you are starting to learn your animals; you come across two animals: a cat and a dog.

At first, you will most likely have no clue what these animals are (unless you have an exceptional IQ). However, as time goes on, you’ll start to learn about features that make up a cat or a dog. For instance, you will intuitively associate whiskers with a cat and droopy ears with a dog. You might make a lot of mistakes, but you eventually learn from them, and soon, you’ll have this cool superpower ️of identifying your animals!
That’s what machines do: form a superpower! They learn and make mistakes, learn and make mistakes, learn and make mistakes…you get the idea. After this learning process, they are able to complete a specific task rapidly and quite efficiently. If you think about it, these machines mimic humans, which is both cool and a bit creepy at the same time!
Can machines only classify?
No, they can, believe it or not, do a variety of tasks. However, these tasks can either be split into the primary types of machine learning or the primary purposes of machine learning. Let’s scratch the surface on both.
Primary types of Machine Learning:
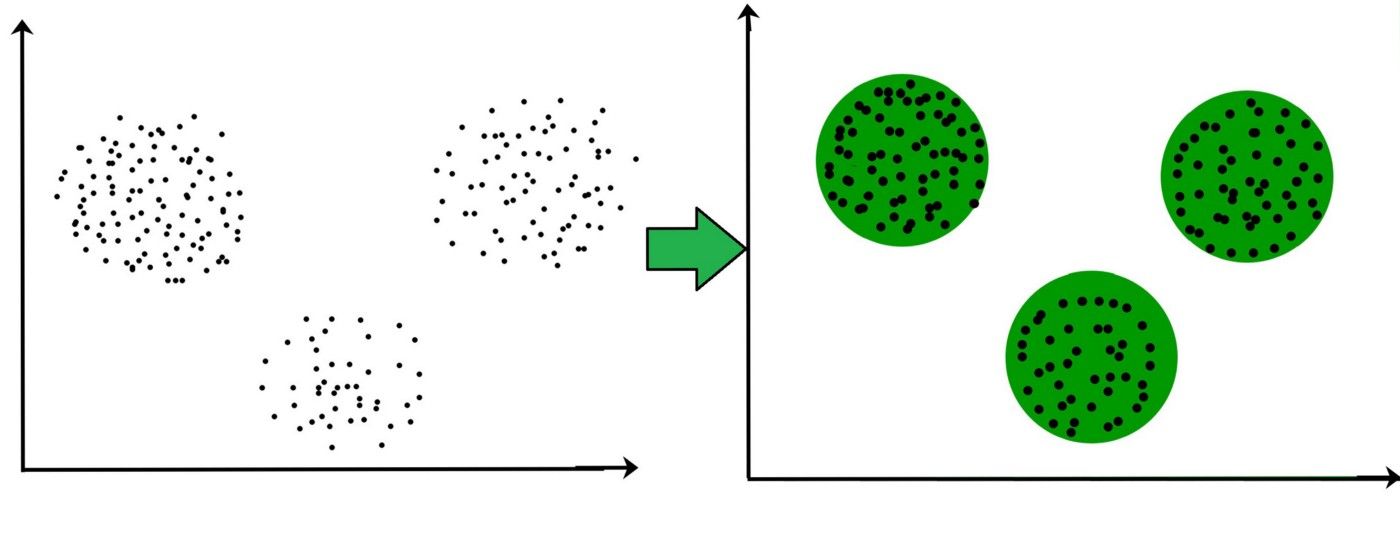
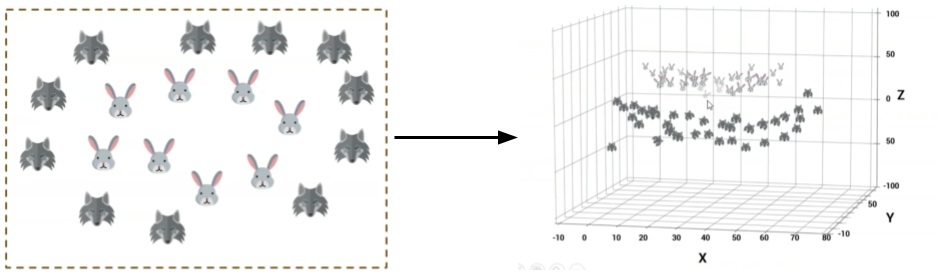
- Unsupervised Learning
- Solves problems with associating and clustering the data.
- The machine doesn’t receive any training data to train with.
- It uses no knowledge initially and identifies patterns and discovers outputs without any supervision.
- An example would be a machine clustering dots of different colors by different sections; the machine wouldn’t know its colors, but it could use other factors to divide it up, like by how light/dark they are.
2. Supervised Learning
- Has training data, that is labeled, beforehand and is supervised, hence the name.
- It learns using this data by improving its model to become more efficient after every epoch (one cycle of going back and forth).
- It outputs data that helps with regression and classification problems.
- For instance, the machine can classify if an email ✉️ is spam or not by, firstly, having training data on what an email that is spam and one that isn’t looks like; then, it would use this algorithm to separate the emails into these 2 categories.
3. Reinforcement Learning
- Reinforcement learning is truly mind-blowing → it’s the basis of guiding machines to play games to even self-driving cars.
- It uses a system based on rewards and the agent trying to capitalize them; this turns out to be an exploitation vs. exploration scenario.
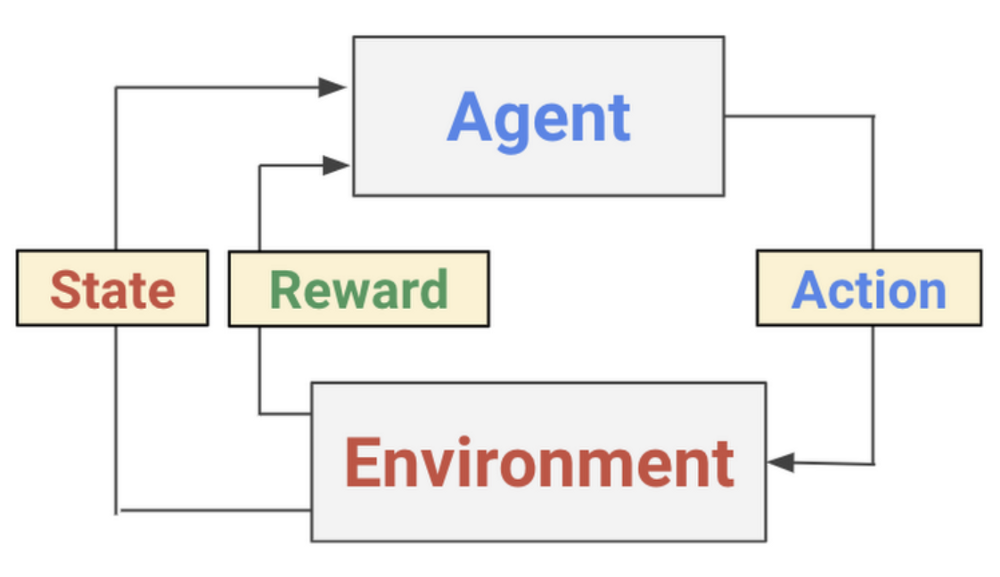
- The agent navigates throughout the environment and performs actions, which can be rewarded, as shown in the left diagram.
- The machine learns from its errors with this method and tries to avoid them in future instances.
The cool thing is, we implement “reinforcement learning” in our day-to-day lives as well. For instance, as an agent, I try to improve on productivity. Throughout my environment, I try implementing/taking action on certain techniques. If these techniques improve my productivity, I get a “reward” of effectively using my time; on the contrary, if it doesn’t work for me, I avoid using it.
Primary purposes of Machine Learning:
Another way to think of the problems that machine learning can solve is through comprehending the purposes of machine learning. The most prominent ones include:
- Regression
- Uses supervised learning
- Is used to predict/forecast (e.x. predicting Amazon’s stocks, forecasting the weather for the next week) - Classification
- Uses supervised learning
- The output is focused on classifying the data into categories
- For instance, classifying if something is a math question or a science question - Clustering
- Mostly uses unsupervised learning, but can use supervised learning in some instances
- The output aimed towards grouping of similar inputs
- E.x. clustering all triangles in one group and circles in another
7 steps to success (in Machine Learning)
All these purposes, all these types of machine learning can’t just be done in an arbitrary way. So, developers use a series of steps (7 crucial ones) to ensure their machine learning model works efficiently.
Note that these steps correspond to supervised learning, but also apply to unsupervised and reinforcement learning.
- Define the objective
- Think about what the goal of your machine learning model is going to be
- What is/are the input(s)? What should the output(s) be?
- What kind of problem are you tackling — classification, clustering, or regression?
2. Gather the data needed
- After thinking about what data you will need, collect data from reliable sources.
3. Prepare the data
- Transform your data into the desired format, like a .csv format or a .txt file.
- Clean your data by removing unnecessary data by ensuring it doesn’t have an unequal amount of inputs on each spectrum, and there aren’t any missing values.
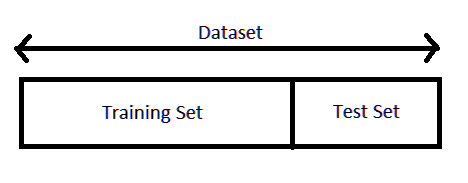
- One important substep in preparing this data is splitting it up into a
20% : 80% ratio, so 20% of your data is for training and 80% is for testing; this is called data slicing (as shown in the picture below).
4. Exploratory data analysis
- Take a bit of time understanding the data you have, more specifically the correlations.
- Furthermore, try to accurately predict what the output for some pieces of data might be; this will give you more insight into what your model should output.
- Lastly, the most important task to accomplish here is to pick a machine learning algorithm.
5. Building a model
- The machine learning model you build should be centered around your algorithm.
- Use the training data to train the model.
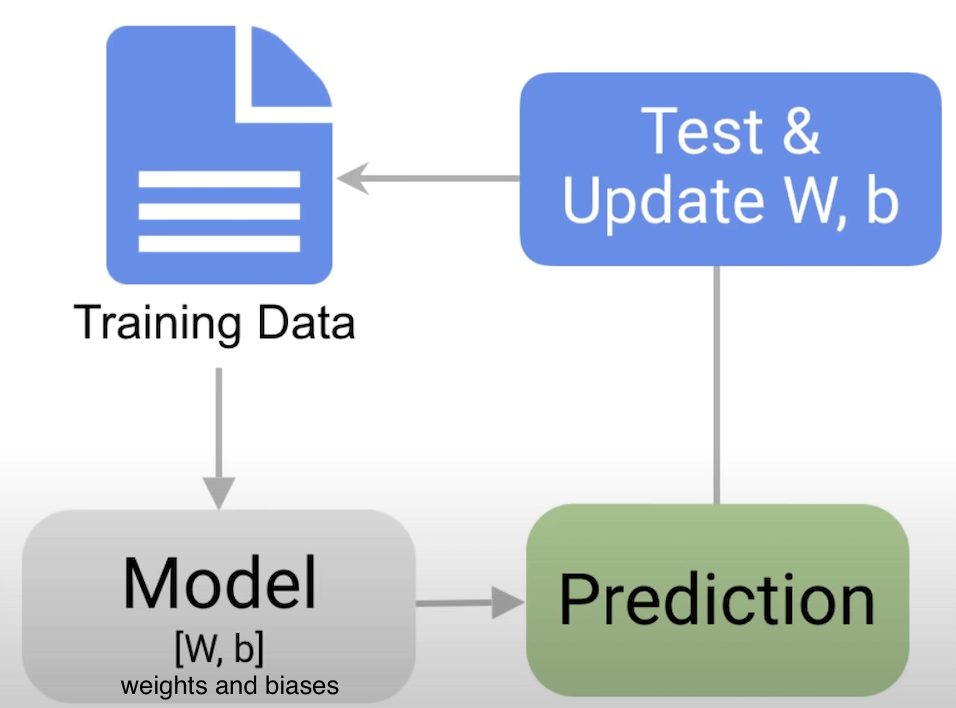
6. Model evaluation and modifications
- The model should be tested with the evaluation data.
- To enhance its accuracy, use parameter tuning by changing some of the features of the model, like the number of epochs it goes through, initialization values, etc.
7. Predictions
- This model should be tested with unseen testing data to predict its accuracy of in the real world.
But…how can it learn to do a specific task?
To center your machine learning model to solve a specific problem or finish a task in an efficient manner, it has to use an algorithm.
Just like there are algorithms to solve a Rubix cube, there are algorithms to help machines learn.
The algorithm you use must be chosen based on the problem you want to solve/the output you want. There are numerous algorithms that machine learning models use; however, let’s focus on some of them and how they work!
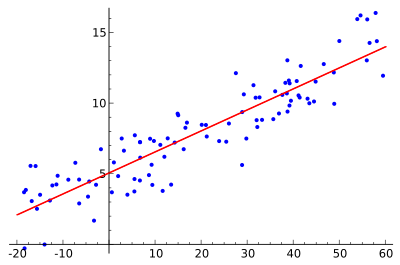
Linear regression:
- Linear regression involves 2 variables: an independent variable and a dependent variable. The independent variable changes the position of the dependent variable in the graph.
- With the data points on the graph, this algorithm tries to find the straight line of best fit using a series of math formulas.
- In most instances, the line cannot accurately replicate the arc in its true relationship and the difference between each point and the shortest distance to the line is the error.
- In linear regression, the line of best fit has to be straight (linear). If it was a squiggly line for the training data, it would touch all the points, but when getting new data, it would have a large error; this is called overfitting.
- Consequently, you can use this line to predict/forecast future data.
Logistic regression:
- Logistic regression predicts the dependent variable based on one independent variable or a set of independent variables, which can be discrete (e.x. astrological sign) or continuous (e.x. age).
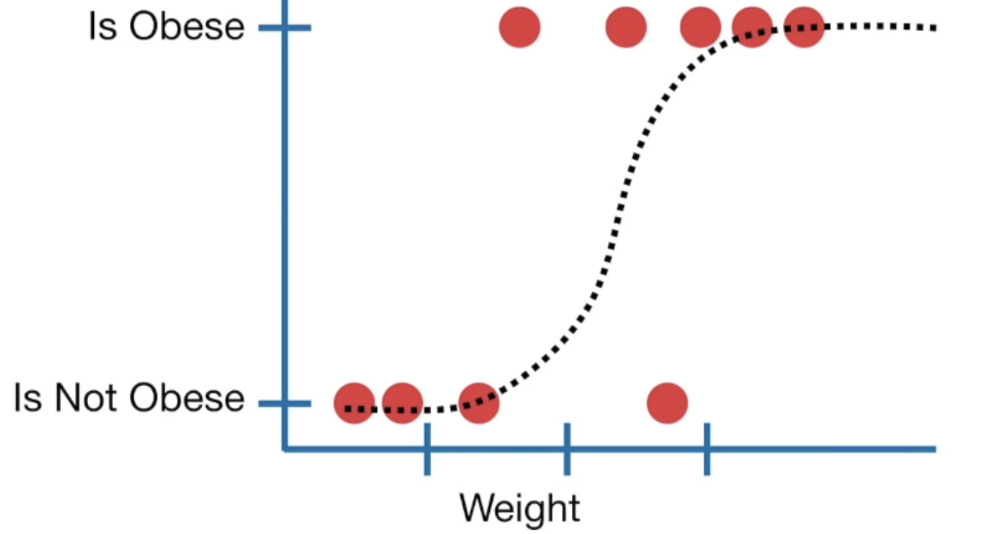
- It determines if something will be true or false instead of a continuous output.
- As shown in the diagram, the line to predict from the dependent variables is not linear.
- Instead, it’s an “S” shaped “logistic function” called a sigmoid, which tells you the probability by rounding off to 0️ or 1️.
Decision tree:
- The decision tree algorithm is a fairly simple concept.
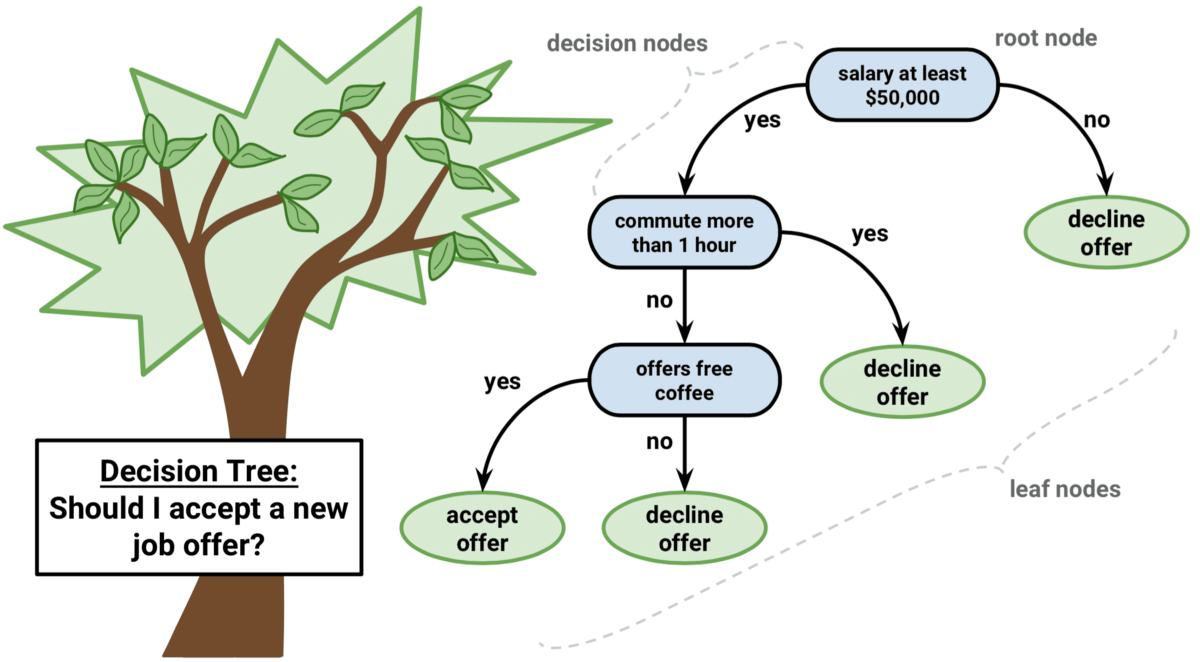
- Decision trees have root nodes (the starting point of a tree), internal nodes (decision points/predictor variable that eventually leads to the prediction of the outcome), leaf/terminating nodes (final class of the outcome), and branches (the connections between nodes that represents a response, like yes or no).
- There is a really cool application of decision trees that you may have heard of: Akinator.
Random forest:
- The random forest algorithm is a combination of decision trees to enhance accuracy.

- Think about it this way: we have trees that all vote on the output and the majority rules.
- However, these trees are all different from each other because having the same decision tree and iterating it multiple times is pointless.
- The typical and primary method to make them different from each other is by bootstrapping. This method comprises of dividing the data set into randomly selected training samples; for these datasets, two uncorrelated decision models would be created. Lastly, you would use bootstrap aggregating/bagging to come to a consensus of the random forest’s output.
Naïve Bayes:
- This algorithm uses a probabilistic approach to solve problems.
- The predictor variables in the algorithm are independent of each other.
- For instance, if you are trying to identify a fruit, you could have the predictor variables of color, shape, and taste. Thus, when you get the input that it’s orange in color, it’s a sphere, and is tangy, the model would output an orange. To sum it up, these variables rely on each other to get the correct fruit output.
K-Nearest Neighbour (KNN):
- When you have clusters and you want to classify an unknown input, you would use this algorithm.
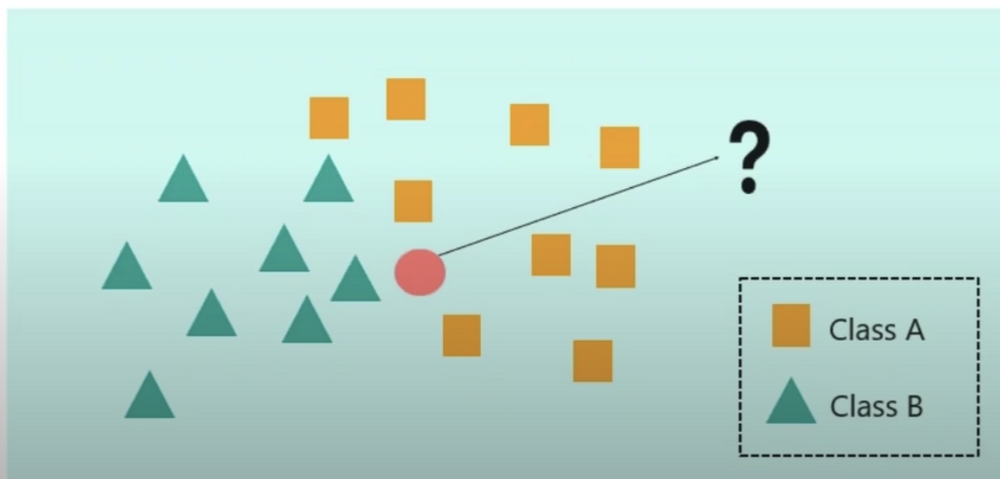
- For instance, let’s say we wanted to find the datapoint (red circle) in the 2 clusters of green triangles and yellow squares.
- We need to find the value of K — this is complex and requires high-level math, so if you are at that level, check this out.
- Once you know the value of K, you would use the Euclidean distance (shortest distance between two points) to find the closest K points to the data point.
- Then, the algorithm finds the majority of the class in the area and assumes that class as that of the datapoint.
Support Vector Machine (SVM):
- In an SVM, you want to divide a group into 2 different classes by using a hyperplane (the decision boundary to classify or separate them).
- You would find the hyperplane by first calculating the margin, which is the maximum difference between an object of each class (a support vector). Then, you would draw the hyperplane in the middle of the margin with an equal distance to the closest SVM in each class.
- In a linear SVM, you have a hyperplane that is between the same distance of the support vectors, so it can separate the two classes in a fairly accurate manner.
- In a non-linear SVM, data can’t be separated using a straight line. Thus, we would use the Kernel Trick, which adds another dimension to the graph and makes the data separable by a linear line.
K-Means Clustering:
- In this algorithm, data points are classified into K amount of groups so that they are as different as possible from other groups, but very similar between the group.
- Steps followed in this algorithm:
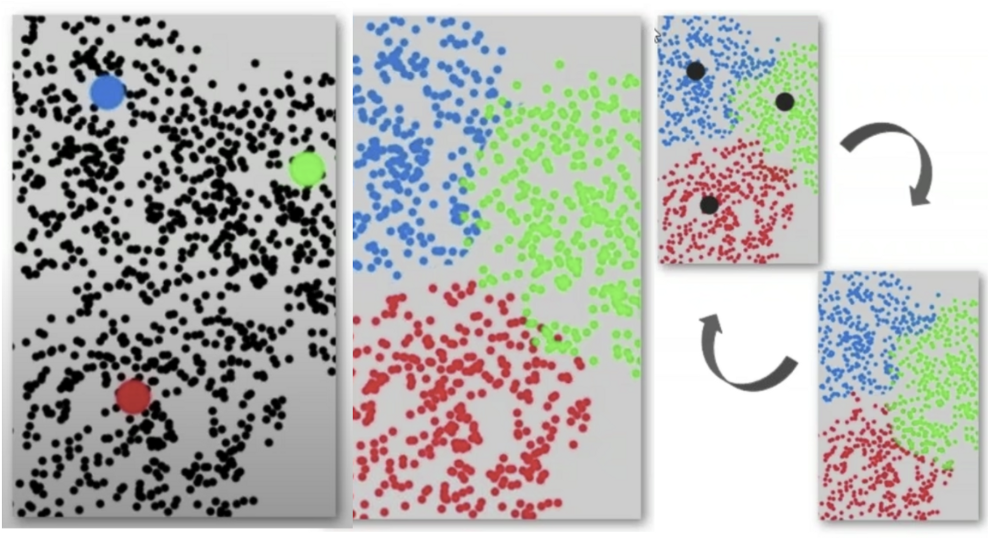
- Decide the clusters (K) to be made (similar to the KNNs, this involves complex math).
- Find the centroid of all the clusters.
- The algorithm calculates the shortest distance of points from each centroid → then, you’d cluster them.
- Another centroid is picked and #3 is repeated until there is a lot of repetition in centroids/they are very close to previous ones.
Wow! I can’t believe it!
We are nearing the end of the article and there was a plethora of information covered, so let’s do a recap. In this article, we talked about what machine learning is, its types and purposes, the 7 steps of machine learning, and the numerous algorithms under its umbrella.
Machine learning has a vast amount of promises in different fields and it presents a positive outlook that we should definitely look forward to!
Thanks for reading this article and I hope you took away something valuable from it!


AI accelerator insider insider
Thank you for subscribing
Level up your ai accelerator insider career & network with ai accelerator insider experts.
An email has been successfully sent to confirm your subscription.
 Follow us on LinkedIn