
Most businesses, organizations, or processes consider machine learning models as any blackbox model where we feed training data (we train the model, we feed new sets of data, and get certain predictions).
Without machine learning, it's simple rule-based. Applications we've developed, before the era of machine learning and artificial intelligence, where we have certain rule groups, we try to write a program out of it and make the system work according to the rules we define.
However, with machine learning, these sorts of rules are patterns we expect the machine to discover by itself. We expect the machine to model the entire data that best represents the data and give the necessary output.
When the machine learning model predicts a certain value, it can be a numeric value or any category, we often don't get the reasoning behind it. If your machine learning model predicts a certain number, we don't know why it’s saying so and there’s no way to understand and go back to evaluate why it’s saying so.
Since more and more businesses are adopting AI as a part of their decision-making process, we need to highlight the fact or the reasoning behind how the model behaves.
What are the consequences of poor prediction?

There can be multiple consequences for poor prediction. In critical applications, such as where an applicant has applied for a loan there can be serious consequences. A machine learning-based model is trying to get necessary input from the person and then maybe just says that your loan application has been denied but if the person just gets the final output of what the model is telling, how exactly will the person know why his application has been rejected?
Another example could be that your office has a facial recognition system. Based on your current image or current ID card, your access has been denied because your system wasn't able to recognize you. Then, if there’s no other fallback plan, you won't be allowed any access to the premises of your office.
There are multiple news articles, which often talk about some of the problems with AI models or AI algorithms, mostly because of the inherent nature of bias that exists.
Algorithms themselves don’t have any bias but the underlying data might have an inherent bias due to the human beings who are training them or the nature of the data that has been collected. These biases can have severe consequences on racial and gender-related discrimination or it could be completely ignoring a certain section of the data population itself.
This is why we need to understand that whatever the model is predicting has to have some kind of reasoning behind it and understanding this reasoning is more and more important nowadays.
Principles of XAI
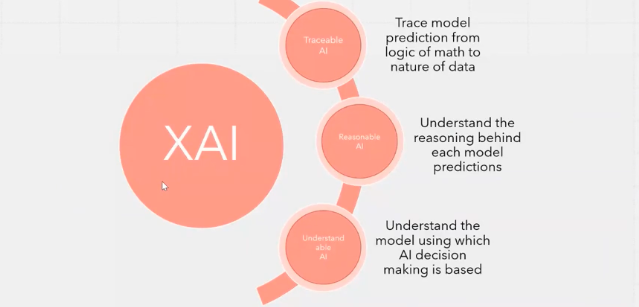
Explainable AI considers the entire AI model to be traceable so whatever the model is predicting, we should have a path to go back and understand the main mathematical logic behind it for the final decision making or the prediction the model gives.
Then, it has to be reasonable. Whatever the logic or the prediction the model gives, there has to be some kind of reason which should be intuitive enough for a human being to understand.
Finally, it has to be understandable. Whatever the model's saying, there has to be some sort of interpretability for the end stakeholders or the end consumers of the AI model to be able to understand why the model is giving the results it's giving.
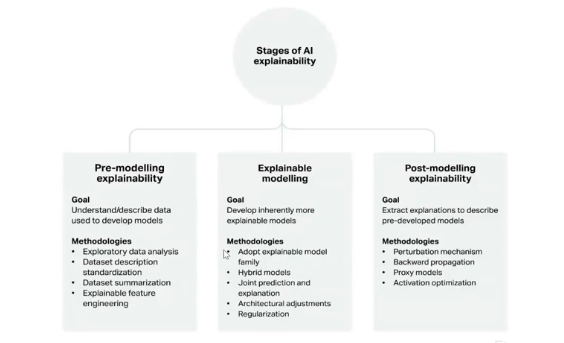
When we talk about different stages of AI explainability, it all starts before the modeling happens and before the model is trained.
It starts from the data itself, mostly a data scientist and a specialist will perform an exploratory data analysis to understand if the data set has bias and form hypotheses out of the data which helps the data scientist figure out if these are the right set of algorithms to model the data.
This happens before the modeling is done and is known as ‘pre-modeling explainability’.
Next comes the explainable modeling, where the models used have explainability inherently built into it. These can be any decision trees-based model or any linear regression model and they’re explainable by themselves. Typically, this interpretability lifecycle happens during the modeling stage itself and is called ‘explainable modeling’.
Finally, the most popular approach that the AI research world is focusing on is ‘post-modeling explainability’. Post-modeling explainability ensures that whatever the results we get are actually model agnostic. The methods or approaches we use to conclude the model prediction are not dependent on the type of model or the algorithms we use.
Accuracy: Interpretability tradeoff
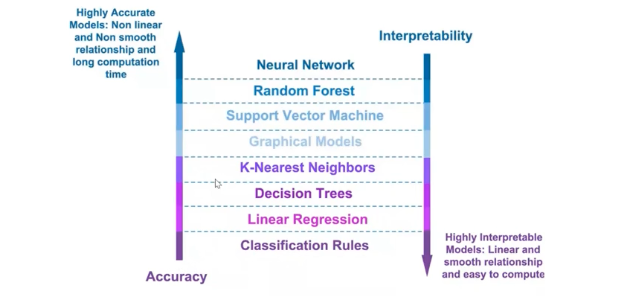
There’s always a trade-off between accuracy and interpretability. As mentioned earlier, some models are inherently interpretable and we don't need to spend much time in making those more explainable, however, considering the use case or the data set we will be using, the accuracy of the model might not always be good for those interpretable models.
On the other hand, for certain complicated deep neural network architecture, it’s highly possible to get more accurate models but it gets very difficult to draw explainability out of those complicated models.
The way most businesses or most business processes where machine learning and deep learning are used get around this trade-off, is by getting a good amount of accuracy beyond a certain threshold but at the same time drawing interpretability out of it so the business stakeholders are more confident in trusting what the AI models tell us.
Model agnostic explanation methods

There are a lot of models or approaches from which extracting that interpretability is very difficult. That's why most of the AI world is focusing on model agnostic explanation methods.
When we talk about model agnostic methods, these are the broad four-level categories or types of explainability we try to draw from the inherent data itself:
- Knowledge extractions: From the input data or the output of the model, we try to extract certain statistical or mathematical information to either draw a hypothesis or draw a conclusion about what the model is stating.
- Results visualizations: This is one of the widely followed methods for understanding what the machine learning model is stating.
Whatever the results or the output we get from a machine learning or deep learning model, we try to pass through another layer of algorithm (this can be any proxy model or surrogate model which are simpler and more interpretable) and from the results, we try to justify whatever the model is stating.
These models can be similar to simple linear models or decision trees-based models which have a higher level of interpretability.
- Influence methods: Influence methods help us to understand what are the key important features or parameters within the model that try to influence the final decision-making process of the model.
- Example-based methods: This is probably one of the methods or approaches which is closer to bringing explainability to a common person who doesn’t have any understanding of the model.
Certain instances of the data sets are used to explain the behavior of the model. We look at certain data points or something which is not part of the training data set altogether but we try to relate it to the training data set and so if we change the new data set or the test data set by a certain degree, then there is a possibility that whatever the result we are looking for can be obtained.
It’ll give examples or reasoning behind what the model is stating by taking a reference to the data instance involved in it.
Interpretation in data science life cycle
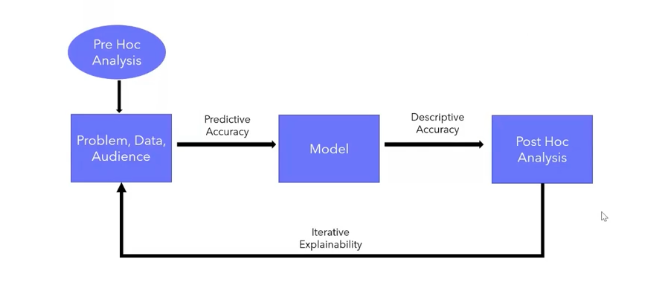
There are three types of explainability methods or stages of explainability applicable to the data science life cycle but mostly it’s done through a pre-hoc analysis. A pre-hoc analysis is where the data scientists do exploratory data analysis on the data itself to understand the problem, relate the data with the problem, draw some hypothesis out of it and then try to build the model considering the predictive accuracy of the model.
For a common person or a business stakeholder, descriptive accuracy matters a lot. This is why, along with pre-hoc analysis, post-hoc analysis is important where from the results of the model we try to draw conclusions from it.
This is an iterative process where we try to take feedback from the business stakeholders and try to improve the descriptive accuracy of the predictive accuracy, whichever is more important for a particular use case or problem being solved.
Model agnostic XAI for ML models
Knowledge extraction methods during EDA

Exploratory data analysis (EDA) is one of the most important steps of the entire data science process. As a data scientist, I am interested in understanding the data more and if it helps us to solve the business problem or not.
As a part of the EDA process, we try to extract information from the data, which will help us understand the final performance of the model or the final results which the model will be giving us. For example, when we have two types of data set testing and training, if the distribution of the data isn’t the same or if there’s divergence within the data then it means there’s a data drift.
Looking at the graph above, which tells us the distribution of the data for different categories involved, we can clearly see that some categories have more data points than others so there’s an inherent chance of the model to be based on the majority class no matter the amount of hyper parameter tuning or model optimization we do.
If we aren’t covering the entire spectrum of the data, then our data set or our models will not be that much trustworthy on datasets that don't have that much data to be trained.
We can also do correlation heatmaps when we're working on certain clusters. We try to visualize and see whether the clusters are clearly defined and draw statistical values from the data like the median value, the range of values, the interquartile ranges, the standard deviation between the data, and so on.
These are typical statistical methods we apply to the data but the idea is to extract as much knowledge as we can from the input data set itself to draw hypotheses based on which we can justify the results or the outcome of the model.
Knowledge extraction using decomposition trees

This knowledge extraction method is not only done on the input data but also on the output data where we do a root cause analysis. When we have the results of the model, we try to break it down and go back to the key features used in the model to do a decomposition tree which tells us how important those features are or the combination of those features to get the final results we are expecting.
Result visualization using surrogate models
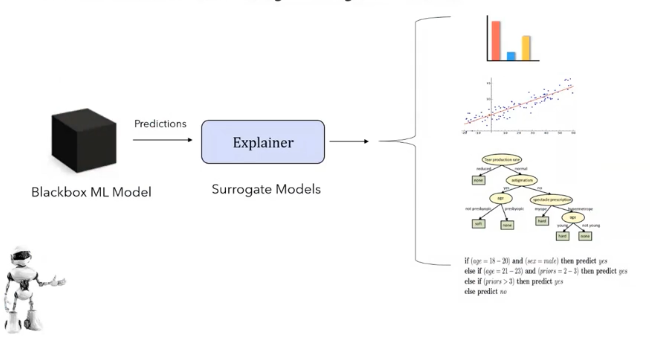
Visualization is also one of the popular methods, where whatever the results we get from the blackbox machine learning model, we try to have another explainer algorithm. These are surrogate models, which are simple models like linear regression decision trees or any rule-based models that help us understand what the model is stating.
These are easy to implement and use, but there are certain models for which getting these visualizations can be more difficult or the explanation we'll be able to draw from it might be limited.
Influence methods using feature importance, sensitivity analysis, and key influencer maps
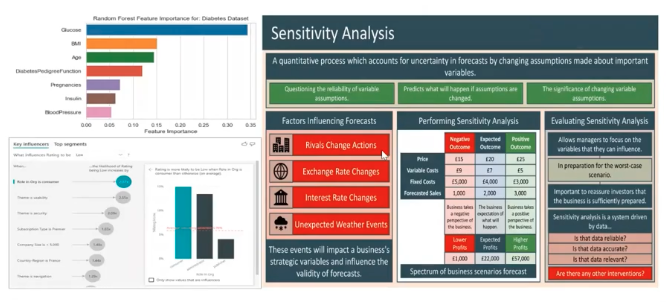
With influence-based methods, we try to understand the main key features based on which the model is trying to make a decision-making process. For example, for predicting diabetes your blood glucose level, BMI or age play a very vital role in making the final prediction. This has more impact on the data.
We also do sensitivity analysis, which means that we try to vary the value of some of the important variables within the data set by a certain amount to see what impact it has on the outcome.
For example, if I increase the blood glucose level values, will it help me to understand whether the model would be predicting more and more data points as a diabetic, or not? We try to understand the relationship of the outcome concerning the input key features and try to understand its sensitivity.
Similarly, key influences not only tell us that these are important features but also helps us to understand how much. If there’s a variable that has a 2% or 5% chance of impacting the final outcome, based on that, we try to understand the importance or the impact it can create by a certain amount.
Example-based methods using counter-factual explanations

The example-based methods are more important to understand the actual reasoning behind the model for someone who doesn't have that much exposure to basic mathematics or the statistical reasoning behind the models we have seen.
There’s a popular approach called ‘counterfactual explanation’. Taking the same loan application example, if someone applies for a loan and the model predicts the loan application will be denied, then the data sets or the parameters we use within the model also goes through another counterfactual generation algorithm.
This tries to compare between the new data and the data set that has been used to train the model and tries to give a suggestion as a final output. Therefore, this makes more sense to a person who is consuming the results of the AI model.
After the loan application has been denied, the model can give a suggestion that if the salary of the applicant is increased by 50k or if the applicant pays the credit card bills for the next three months on time, then there’s a higher chance the algorithm would approve the loan request.
Model agnostic XAI for DL models
Some of the methods we discussed are also followed for deep learning-based models or approaches, but there are additional steps added for deep learning models, especially when we are dealing with unstructured data like images, text, any audio signals, and so on.
Whenever we’re dealing with any tabular data set, it’s much easier for us to draw explanations but whenever we’re dealing with any unstructured data, then it gets difficult especially when we go for any complicated deep learning model.
Influence methods using wise relevance propagation

One of the key approaches, which is often used in the image domain when we talk about explanation, is ‘layer-wise relevance propagation’ and this comes under the influence method.
When we talk about any deep neural network model, it’s always believed that it’s the flow of the gradient values from the higher layers of the model to the lower layers. If it’s maintained consistently throughout all the different layers of the model, then the model’s performance is much more accurate and the output is more reliable.
The gradient flow or the flow of information from the different layers of the model is very important.
To understand the flow of information, there are typical approaches used, which are:
- Saliency maps: These give more weight and add extra values to the portions of the data which contribute to the final decision-making process of the data.
- Guided backpropagation: We’ll be initializing a model or the weights and biases which the deep learning model tries to learn with initial random values and then it tries to complete one level of forwarding propagation to come up with values of no loss and based on the loss values, it tries to minimize it, go again and updates the weight and bias.
This backward route is also often called backward propagation. In this case, it’s called guided backward propagation because it’s a control mechanism that tries to pick up specific points contributing to the final decision-making process and the final loss functions involved in it.
- Class activation methods: This method tries to activate or assign more weight to certain segments of the image and highlight them.
Grad cam is a gradient-based class activation method, which highlights segments of the image that are more important or the model is looking at these segments of the image to make the final decision-making process.
To understand the inherent workings of the models, we have concepts like layer conductance or layer activation which try to analyze the different layers of the model or different activation functions within the model involved.
Influence-based methods - Visual attention map

The example above is an instance where we see an attention-based encoder-decoder-based model applied to an image. This is an example of multimodal prediction where the input was an image data set and the expected output was a caption or a text-based caption that best describes the image.
Here we can clearly see the caption makes a lot of sense, it says that a man is riding a bike in the woods but how do we know what the model is telling from this text data is relevant or not.
This visualization method called ‘visual attention map’ also comes under the influence-based method, which tries to highlight a group of pixels or segments within the image that relates back to the text output it has given. Even complicated models like any attention-based encoder-decoder architecture can also go through such methods of expandability and visualization techniques to draw explanations.
Knowledge extraction - Representation-based explanation

Let’s take the representation-based explanation where we try to extract knowledge from the input on the output of the data and try to relate it to some human-defined concepts. Above is a popular framework by Google AI which helps us to understand the main important concepts a human being would use to explain the nature of the model.
For example, for the zebra, black stripes and white background is very important. The model tries to learn all these representations and tries to explain the underlying functioning of the model from them. This is called representation-based explanation.
Knowledge extraction using model distillation

This method is similar to the approach of result visualization using surrogate models, where we tried to use a simple model along with a complicated model but the main differences here we try to compress the information of a complicated deep neural network model into a simple shallow model which helps us to understand the results of the model.
We try to extract the information from both the input data, which we feed to the main deep learning model, we pass both to the distillation model or a simple model, and then try to draw some sort of explanation out of it. This is called ‘interpretable mimic learning’ where the main information or main logic that the complicated models try to learn is passed to the simple model to get simplified across the simpler model.
Example-based methods using counter-factual explanations

Similar to machine learning approaches, the example-based methods here are more impactful for a common person to understand.
For example, we've two different images of a bird, and to change the first class of the bird prediction into the second class, we need to also suggest what portion of the image should be changed by what extent or by how much. In this case, we're going to say the shape of the beak of the bird is different.
If it’s increased or if the color is changed to orange then the class of bird will also get changed into the other one.
Typically, this counterfactual explanation helps us to understand what are the features that need to be changed or modified and by how much to change the results of the model prediction. This is probably easier for a common person to understand and the counterfactual explanations are also applicable for complicated deep learning models, which work on unstructured data like images.
Popular frameworks for XAI

Most of the approaches we've discussed can be implemented by all of these five frameworks:
- LIME
- SHAP
- ELI5
- SKATER, and
- TCAV.
These methods can help us to make our model results more interpretable.
LIME focuses on the idea of local interpretation and is also model agnostic. SHARP is a concept based on game theory. It's a two-player zero-sum game where the two players try to compete against each other. If one tries to score more points, it will draw a penalty from the other player.
ELI5 is very simple to use and it gives a good understanding of what are the key features which contribute to the final decision-making. SKATER is a unified framework, which combines LIME and some of the other gradient-based methods we have seen helping us to understand interpretability at a global as well as a local level.
Finally, TCAV is a concept-based method that tries to draw interpretability and relate it to how a human would think.
LIME

Every complex model can be interpreted or can be explained at a linear scale by a simple model. If I have a very complicated model, at the local scale, we can draw certain data points which will help us to understand the entire functioning of the model and which will relate to the global working of the model.
LIME is quite useful and can work for both images and text data and even structured data. It’ll tell you the key features that are contributing to the final decision-making process of the model.
SHAP

The main importance of the SHAP value is that it not only considers all the features individually, but it tries to consider the additive effect of multiple features together and based on conditional expectation.
This means that if I have five important variables, and it’s highly likely that variable one and variable two occur together, then what is the additive effect of it? Or what is the total sum effect of both those features, or variables, to occur together at a higher value?
These kinds of additive effect based on the conditional expectation of the features is mapped clearly using SHAP whereas some of the other use cases or other techniques try to mostly focus on individualistic variables or features.
ELI5
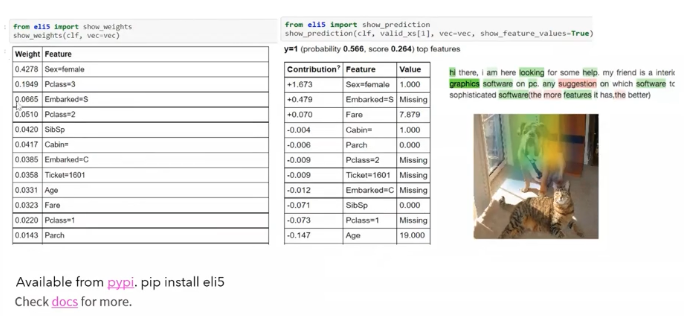
ELI5 is very simple to implement. It can work for both images, text, and even structured data. It tries to highlight the key weights for each of those important features and what is the contribution of each feature or for the prediction of that particular data point.
SKATER

SKATER is a unified framework that combines most of the methods we have discussed. From feature importance, from partial dependence plot to understand the impact of the variable. It also has an integration with the LIME framework, which tells us the extent to which a set of features contribute to the predictive or the prediction class.
TCAV

TCAV is new. It helps us to relate the explanations which a common person can understand. The idea of TCAV or testing with concept activation vectors is that any complicated neural network tries to draw certain signals and tries to relate based on certain high-level concepts which a human being would be using.
These high-level concepts try to obtain or try to relate back to the data set and draw explanations based on that.
Typically, it tries to learn the concepts from the data, and to make the model learn a concept, it needs some examples of that particular concept.


AI accelerator insider insider
Thank you for subscribing
Level up your ai accelerator insider career & network with ai accelerator insider experts.
An email has been successfully sent to confirm your subscription.
 Follow us on LinkedIn

